
Fig. 3
- ID
- ZDB-FIG-130726-29
- Publication
- Head et al., 2013 - Activation of canonical Wnt/beta-catenin signaling stimulates proliferation in neuromasts in the zebrafish posterior lateral line
- Other Figures
- All Figure Page
- Back to All Figure Page
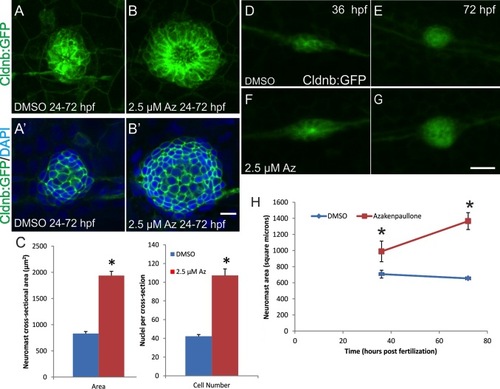
Az leads to increased size of deposited neuromasts and increased growth of the neuromasts following deposition. Tg(cldnb:gfp) zebrafish were treated with either 2.5 μM Az or DMSO as a vehicle control from 24–72 hpf. A,B: Projections of z-stacks showing the difference in size of the second-most anterior neuromast from DMSO-treated (A) or Az-treated (B) zebrafish. A′,B′: Individual z-sections from different neuromasts from DMSO- (A′) and Az-treated (B′) zebrafish showing the cross-sectional area of the neuromast (labeled with cldnb1:gfp) and the nuclei (DAPI; blue) in that cross-section. C: Quantification of the cross-sectional area of the neuromasts and number of nuclei in a cross-section through the neuromast reveals that Az treatment leads to a more than doubling in the area and number of cells in the neuromast (*P < 0.0001 for both; t-test). D–H: Time-lapse microscopy of Tg(cldnb:GFP) zebrafish treated from 26–72 hpf with DMSO (D,E) or 2.5 μM Az (F,G). Individual frames from one representative time-lapse are shown at 36 hpf (D,F; shortly after the deposition of the imaged neuromast) and at 72 hpf (E, G; approximately 36 hr after deposition of the imaged neuromast). H: Quantification of neuromast size at 36 and 72 hpf. The size of the deposited neuromast at 36 hpf is significantly larger in Az-treated fish compared to DMSO-treated controls. While control neuromasts decrease slightly in area over the next 36 hr as the neuromast condenses, Az-treated neuromasts increase in size by more than 33% (*P < 0.001), suggesting that activation of Wnt signaling triggers an increase in the number of cells in the deposited neuromast leading to growth of the neuromast following deposition. Scale bars: B′ = 10 μm; G = 20 μm. |