
Fig. 8
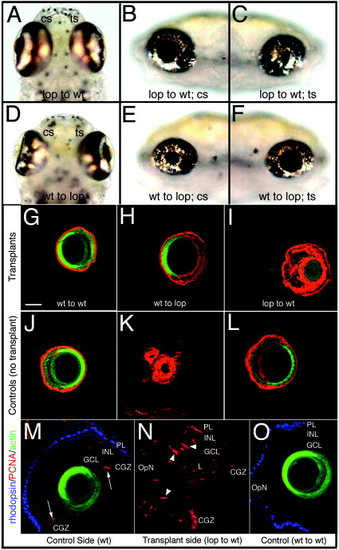
Lens transplantations. A-C: A wild-type (wt) fish with transplanted mutant lens. A: The wild-type lens in the nonoperated eye (cs) appears normal, while the transplanted mutant lens (ts) is not visible. B,C: Lateral views of control (B) and transplant eyes (C) are shown. D-F: A lop mutant with transplanted wild-type lens; the ventral (D) and lateral views of the control side (E) and the transplant side (F) are shown. G-I: Transplanted lens immunohistochemistry is shown (anti-zl-1, red; phalloidin, green). J-L: Controls. M-O: In some cases, mutant lens transplantation into wild-type caused photoreceptor degeneration. M: The control eye displays rod photoreceptors (blue) and proliferating cells at the retinal margin (red; arrows). Lens structure was visualized by phalloidin-AF488 staining (green). N: The wild-type eye with mutant lens lacks rods and exhibits proliferating INL cells (arrowheads). O: Transplantation of a wild-type lens into a wild-type eye is shown. PL, photoreceptor layer; INL, inner nuclear layer; GCL, ganglion cell layer; OpN, optic nerve; CGZ, circumferential germinal zone; L, lens; cs, control side; ts, transplant side. Scale bar = 50 µm in G (applies to A-O). |