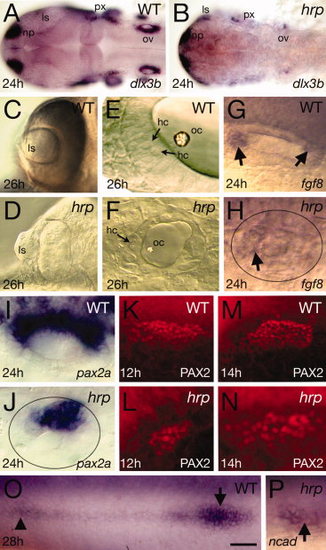
Placodal patterning defects in harpy mutants. Panels show wild-type reference embryos and harpy mutants. A,B: Expression of dlx3b at 24 hr, showing reduced numbers of positive-expressing cells in the mutant. C,D: Optic vesicles in live embryos at 26 hr, showing extruded lens in the mutant. E,F: Otic vesicle in live embryos at 26 hr. Arrows indicate hair cells. Note the absence of layers and miniaturized structures in the mutant. G,H: Expression (arrows) of fgf8 at 24 hr in the otic vesicle. Note that expression is almost absent in the mutant vesicle (demarcated by oval). I–N: Expression of pax2a in the otic tissue. I,J: pax2a mRNA at 24 hr in the otic vesicle. Note that expression reduced in the mutant vesicle (demarcated by oval). K–N: Staining with anti-PAX2 in the otic placodes, showing expansion of the PAX2 territory between 12 and 14 hr in the mutant. O,P: Expression of N-cadherin (ncad) at 24 hr, showing a rosette of the lateral line (arrow head) and the lateral line primordia (arrow). In many mutants, the primordia could not be found. ls, lens; hc, hair cells; np, nose placode; oc, otocyst; op, otic placode; ov, otic vesicle; px, pharynx. Scale bar = 100 μm in A,B, 50 μm in C,D, 10 μm in E,F, 20 μm in G–P.
|
