
FIGURE
Fig. 5
Fig. 5
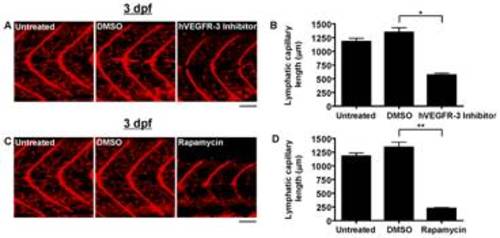
Quantification of lymphatic capillary development after inhibition with small molecules. Red fluorescent images from late-phase microangiograms of Tg(fli1:EGFP)y1 zebrafish are shown, highlighting Texas Red-LMD uptake within lymphatic capillaries. Results of quantitative morphometric analyses are displayed in bar graphs. A and B, Addition of hVEGFR-3 inhibitor in DMSO (n = 30) or rapamycin in DMSO (n = 18) to the aqueous environment significantly reduced lymphatic capillary development at 3 dpf, compared to zebrafish exposed to DMSO alone (n = 21 and 15, respectively). *P<0.0001, **P<0.0001. Scale bars, 50 μm. |
Expression Data
Expression Detail
Antibody Labeling
Phenotype Data
Phenotype Detail
Acknowledgments
This image is the copyrighted work of the attributed author or publisher, and
ZFIN has permission only to display this image to its users.
Additional permissions should be obtained from the applicable author or publisher of the image.
Full text @ PLoS One