
|
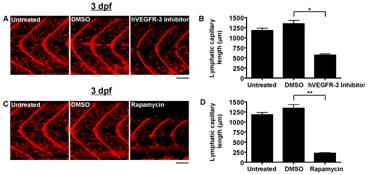
Fig. 5 Quantification of lymphatic capillary development after inhibition with small molecules.
Red fluorescent images from late-phase microangiograms of Tg(fli1:EGFP)y1 zebrafish are shown, highlighting Texas Red-LMD uptake within lymphatic capillaries. Results of quantitative morphometric analyses are displayed in bar graphs. A and B, Addition of hVEGFR-3 inhibitor in DMSO (n = 30) or rapamycin in DMSO (n = 18) to the aqueous environment significantly reduced lymphatic capillary development at 3 dpf, compared to zebrafish exposed to DMSO alone (n = 21 and 15, respectively). *P<0.0001, **P<0.0001. Scale bars, 50 μm.