
Fig. 3
- ID
- ZDB-FIG-121011-21
- Publication
- Love et al., 2012 - Expression and retinoic acid regulation of the zebrafish nr2f orphan nuclear receptor genes
- Other Figures
- All Figure Page
- Back to All Figure Page
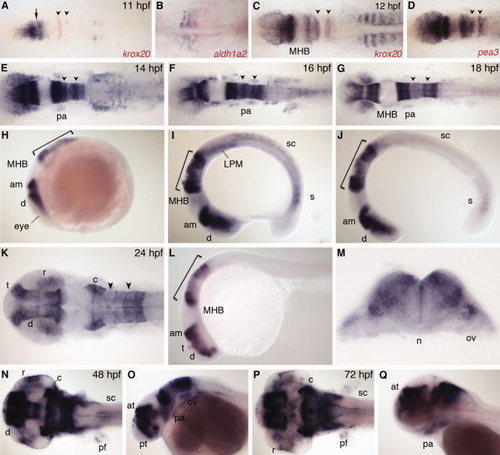
nr2f2 expression. A,C: Dorsal view, co-stained with krox20 (red). Arrow indicates gap between presumptive diencephalon and anterior midbrain. B: Dorsal view of trunk, anterior to left, co-stained with aldh1a2 (red). D: Dorsal view, co-stained with pea3 (red). E–G,K,N,P: Dorsal view. H–J,L,O,Q: Lateral view. M: Transverse section through r5. am, anterior midbrain; at, anterior tegmentum; c, cerebellum; d, diencephalon; LPM, lateral plate mesoderm; MHB, midbrain–hindbrain boundary; n, notochord; ov, otic vesicle; pa, pharyngeal arch; pf, pectoral fin; pt, prethalamus; r, retina; s, somite; sc, spinal cord; t, telencephalon. Arrowheads indicate r3 and r5. Bracket indicates hindbrain. |