
Fig. 1
- ID
- ZDB-FIG-121011-19
- Publication
- Love et al., 2012 - Expression and retinoic acid regulation of the zebrafish nr2f orphan nuclear receptor genes
- Other Figures
- All Figure Page
- Back to All Figure Page
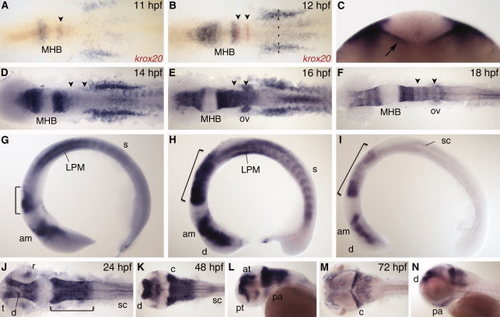
nr2f1a expression. A,B: Dorsal view during early segmentation stages co-stained with r3 and r5 marker krox20 (red). C: Optical section of 12 hours post fertilization (hpf) embryo at anteroposterior level indicated by dashed line in B. Arrow indicates endoderm expression. D–I: Dorsal view (D–F) and lateral view (G–I) during segmentation stages. J,K,M: Dorsal view. L,N: Lateral view. am, anterior midbrain; at, anterior tegmentum; c, cerebellum; d, diencephalon; LPM, lateral plate mesoderm; MHB, midbrain–hindbrain boundary; ov, otic vesicle; pa, pharyngeal arch; pt, prethalamus; r, retina; s, somite; sc, spinal cord; t, telencephalon. Arrowheads indicate r3 and r5. Bracket indicates hindbrain. |