
FIGURE
Fig. 2
- ID
- ZDB-FIG-121011-20
- Publication
- Love et al., 2012 - Expression and retinoic acid regulation of the zebrafish nr2f orphan nuclear receptor genes
- Other Figures
- All Figure Page
- Back to All Figure Page
Fig. 2
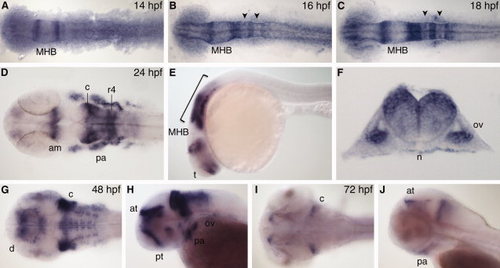
nr2f1b expression. A–C: Dorsal view during segmentation stages, anterior to left. D,G,I: Dorsal view. E,H,J: Lateral view, anterior to left. F: Transverse section through r5. am, anterior midbrain; at, anterior tegmentum; c, cerebellum; d, diencephalon; MHB, midbrain–hindbrain boundary; n, notochord; ov, otic vesicle; pa, pharyngeal arch; pt, prethalamus; r4, rhombomere 4. Arrowheads indicate r3 and r5. Bracket indicates hindbrain. |
Expression Data
Expression Detail
Antibody Labeling
Phenotype Data
Phenotype Detail
Acknowledgments
This image is the copyrighted work of the attributed author or publisher, and
ZFIN has permission only to display this image to its users.
Additional permissions should be obtained from the applicable author or publisher of the image.
Full text @ Dev. Dyn.