
Fig. 2
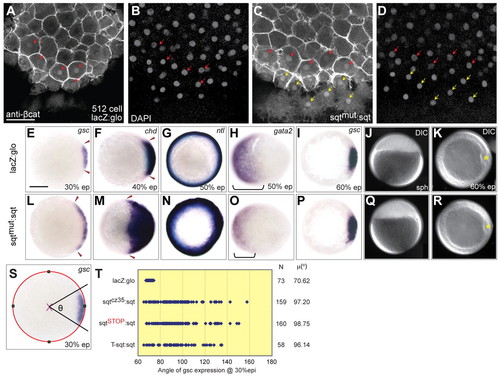
Mutant sqt RNAs expand the dorsal domain in early zebrafish embryos. (A-D) Embryos injected with capped lacZ:glo mRNA show β-catenin in nuclei of about five cells at the 512-cell stage (A,B), in comparison to mutant sqt RNA-injected embryos which show <11 β-catenin-positive nuclei (C,D). Red arrows indicate β-catenin-positive nuclei in the blastoderm, whereas yellow arrows show β-catenin-positive nuclei in the yolk syncytial layer (YSL). DAPI staining (B,D) shows all nuclei in blastoderm and YSL. (E-R) Normal expression of gsc (E), chd (F) and ntl (G) in lacZ:glo-injected embryos at 30% epiboly, 40% epiboly and 50% epiboly, respectively, as compared with expanded gsc (L), chd (M) and ntl (N) in mutant sqt:sqt UTR (sqtmut:sqt)-injected embryos. Expression domain of the ventral marker gata2 (brackets in H,O) is reduced in sqtmut:sqt RNA-injected embryos (O), in comparison to controls (H). At 60% epiboly, gsc expression is similar in lacZ:glo-injected (I) and mutant sqt:sqt-injected (P) embryos. Embryos injected with sqtmut:sqt RNA reach developmental landmarks such as sphere (J,Q) and 60% epiboly (K,R) at the same time as control-injected embryos (J,K). Red arrowheads (E,F,L,M) mark the extent of gsc and chd expression; yellow asterisks (K,R) mark the shield. (S) Schematic showing measurement of gsc angle (φ). The best-fit circle is indicated in red, green squares mark x and y coordinates, and the magenta ′X′ marks the center. (T) Angle of gsc expression in sqtmut:sqt RNA-injected or control lacZ-injected embryos at 30% epiboly. Each blue dot represents a single embryo. N indicates the number of injected embryos for each RNA and μ(°) shows the mean gsc angles. A-D, dorsal views; E-I,K-P,R,S, animal pole views with dorsal to the right; J,Q, lateral view. Scale bars: 25 μm in A; 100 μm in E. |