
Fig. S1
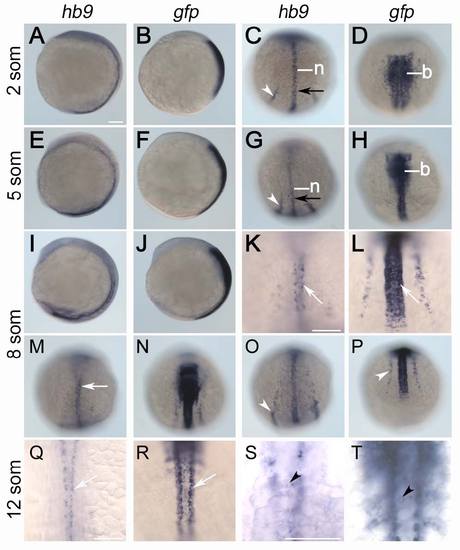
Comparison of early hb9 and gfp expression in Tg[hb9:GFP]ml2. Stains are shown at 2 (A-D), 5 (E-H), 8 (I-P) and 12 somite stage (Q-T). Expression of hb9 is restricted to notochord (n), posterior endoderm (black arrow) and posterior intermediate mesoderm (white arrowhead), motoneurons (white arrow) and at 12 stage also to beta-cell progenitors (black arrowhead). Differently, gfp mRNA in early Tg[hb9:GFP]Lml2 embryos is expressed in the entire hindbrain (b), the anterior spinal cord and in intermediate mesoderm. At 12 somites stage gfp expression in the trunk marks anterior somites, beta-cells and ventral spinal neurons. Embryos are shown from lateral (A, B, E, F, I, J) or dorsal (C, D, G, H, K-N, Q-T) with anterior pole to the top or from posterior with the dorsal side up (O, P). Scale bars correspond to 100 μm. |
Reprinted from Developmental Biology, 365(1), Arkhipova, V., Wendik, B., Devos, N., Ek, O., Peers, B., and Meyer, D., Characterization and regulation of the hb9/mnx1 beta-cell progenitor specific enhancer in zebrafish, 290-302, Copyright (2012) with permission from Elsevier. Full text @ Dev. Biol.