
Fig. 3
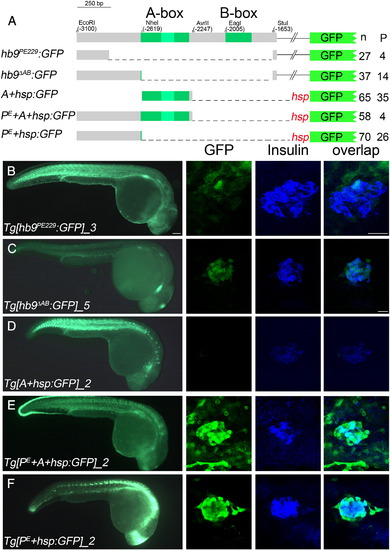
478 bp of proximal hb9 promoter sequences are sufficient for beta-cell specific regulation. (A) Overview of transient GFP reporter experiments with a scheme of deletion constructs on the left and corresponding numbers of GFP positive embryos (n) and embryos expressing GFP in the pancreas (P) on the right side. (B–F) GFP expression in representative transgenic lines at 28 hpf in whole embryos (left panel) and in fixed tissue (right panel) stained with antibodies for GFP (green) and insulin (blue). The right panel shows confocal image projections and the corresponding overlays (right-most panel). Scale bar corresponds to 100 μm (whole embryos) and 20 μm (confocal image stacks). For more details see also Supplementary Table 2. |
| Gene: | |
|---|---|
| Antibodies: | |
| Fish: | |
| Anatomical Term: | |
| Stage: | Prim-5 |
Reprinted from Developmental Biology, 365(1), Arkhipova, V., Wendik, B., Devos, N., Ek, O., Peers, B., and Meyer, D., Characterization and regulation of the hb9/mnx1 beta-cell progenitor specific enhancer in zebrafish, 290-302, Copyright (2012) with permission from Elsevier. Full text @ Dev. Biol.