
Fig. 1
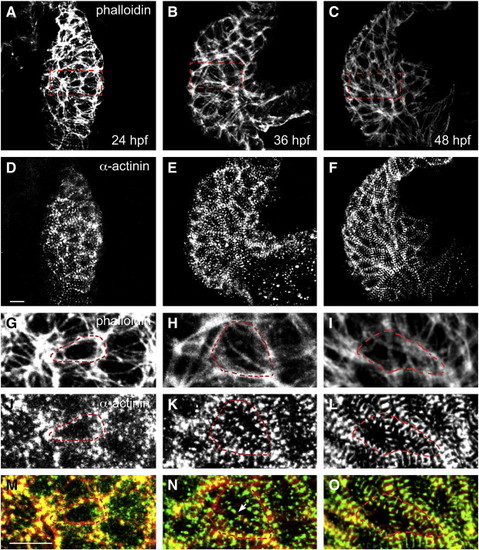
Myofibril maturation proceeds during cardiac chamber emergence. (A–F) Ventral views of dissected wild-type hearts, arterial pole at the top, depict localization of phalloidin (A–C) and α-actinin (D–F) at 24, 36, and 48 hpf. As the ventricular chamber emerges, the striated pattern of myofibril Z-bands becomes increasingly apparent. (G–O) Higher magnification views of the regions marked by red dashed rectangles in A–C indicate the apparent progression of cardiomyocyte surface area expansion (G–I) and increased myofibril organization (J–L). The red dashed polygon outlines an individual cardiomyocyte in each panel. (M–O) Merged view of phalloidin and α-actinin localization reveals the appearance of myofibrils across the cell interior (N, arrow). Scale bars are 10 μm. |
Reprinted from Developmental Biology, 362(2), Lin, Y.F., Swinburne, I., and Yelon, D., Multiple influences of blood flow on cardiomyocyte hypertrophy in the embryonic zebrafish heart, 242-253, Copyright (2012) with permission from Elsevier. Full text @ Dev. Biol.