
Fig. 5
- ID
- ZDB-FIG-120203-2
- Publication
- Weiner et al., 2012 - Fishing the molecular bases of Treacher Collins syndrome
- Other Figures
- All Figure Page
- Back to All Figure Page
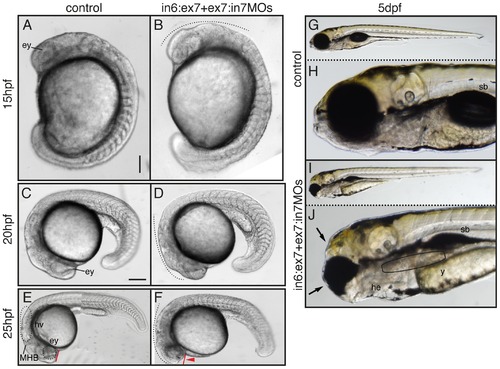
Phenotypic analysis of zebrafish tcof1 MO-knockdown. Lateral views (anterior to the left) of 15 hpf (A–B); 20 hpf (C–D); 25 hpf (E–F) embryos; and 5 dpf (G–J) larvae. Embryos were injected at the 1-cell stage with 1× Danieau (A, C, E, G and H) or in6:ex7-MO+ex7:in7-MO (B, D, F, I and J). At 20–25 hpf, the retina and midbrain-hindbrain regions showed a dark pigmentation (dotted lines), suggesting the presence of apoptotic cells. Abbreviations: ey, eye; he, heart edema; hv, hindbrain ventricle; MHB, midbrain-hindbrain border; sb, swim bladder; y, yolk. Scale bar: in A, 112.5 μm for A–B; in C, 160 μm for C–D, 260 μm for E–F, and 360 μm for G and I. |
| Fish: | |
|---|---|
| Knockdown Reagents: | |
| Observed In: | |
| Stage Range: | 10-13 somites to Day 5 |