
FIGURE
Fig. 3
- ID
- ZDB-FIG-120207-9
- Publication
- Weiner et al., 2012 - Fishing the molecular bases of Treacher Collins syndrome
- Other Figures
- All Figure Page
- Back to All Figure Page
Fig. 3
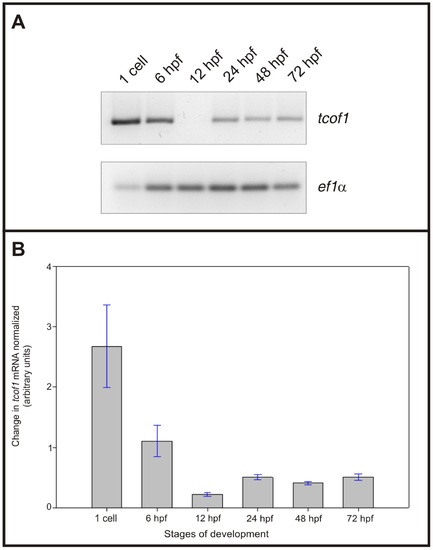
Zebrafish tcof1 mRNA developmental expression pattern determined by semi-quantitative RT-PCR. A: Agarose gel electrophoresis of semi-quantitative RT-PCR products amplified for zebrafish tcof1 and ef1α mRNAs at the 1-cell stage, 6, 12, 24, 48, and 72 hpf stages. B: Bar graph of zebrafish tcof1 mRNA expression profile during embryonic development, normalized to ef1α expression (n = 3). |
Expression Data
| Gene: | |
|---|---|
| Fish: | |
| Anatomical Term: | |
| Stage Range: | 1-cell to Protruding-mouth |
Expression Detail
Antibody Labeling
Phenotype Data
Phenotype Detail
Acknowledgments
This image is the copyrighted work of the attributed author or publisher, and
ZFIN has permission only to display this image to its users.
Additional permissions should be obtained from the applicable author or publisher of the image.
Full text @ PLoS One