
FIGURE
Fig. S5
- ID
- ZDB-FIG-110929-31
- Publication
- Greenhill et al., 2011 - An iterative genetic and dynamical modelling approach identifies novel features of the gene regulatory network underlying melanocyte development
- Other Figures
- All Figure Page
- Back to All Figure Page
Fig. S5
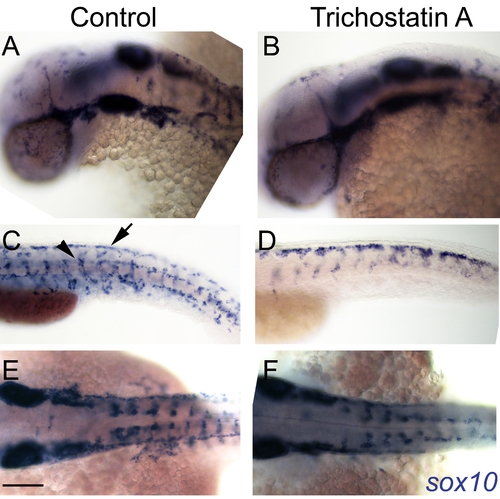
Hdac-dependent derepression of sox10 expression is not seen in mitfa mutant embryos. A–F) In situ hybridisation with sox10 probe showing similar levels of sox10 expression in premigratory (arrow, C) and migrating (arrowhead, C) neural crest cells of mitfa mutants whether treated with 1 μM Trichostatin A from 24–48 hpf (B,D,F) or in stage-matched 36 hpf DMSO control mitfa mutants (A,C,E). Compare effect in WT embryos shown in Figure 8. Scale bar: 100 μm. |
Expression Data
| Gene: | |
|---|---|
| Fish: | |
| Condition: | |
| Anatomical Terms: | |
| Stage Range: | Prim-5 to Prim-25 |
Expression Detail
Antibody Labeling
Phenotype Data
Phenotype Detail
Acknowledgments
This image is the copyrighted work of the attributed author or publisher, and
ZFIN has permission only to display this image to its users.
Additional permissions should be obtained from the applicable author or publisher of the image.
Full text @ PLoS Genet.