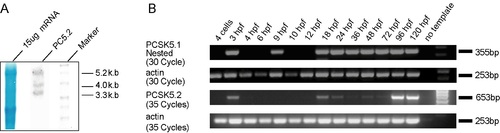
Northern blot, RT-PCR, and Western blot analyses of zebrafish PCSK5 genes. A: Northern blot analysis using strand-specific cRNA probes was performed to confirm the size of the cloned cDNA sequences of PC5.1 and PC5.2. Fifteen micrograms of mRNA from whole adult zebrafish was separated by electrophoresis on 1% agarose/formaldehyde gels and transferred to nitrocellulose membranes. The membranes were hybridized with non-isotopically labeledPC5.1 and PC5.2 cRNA probes and exposed to X-ray film. Methylene Blue staining of 28S and 18S rRNA (lane 1) served as loading controls. PC5.2 detected three transcripts of approximately 3.3, 4.0, and 5.2 kb in size, respectively. Note that the 3.3-kb band is in agreement with cloned sequences for this mRNA (3,319 bp). B: PC5.1 transcript is detected as early as 3 hr post-fertilization (hpf) and throughout all stages of development that follow 18hpf. The PC5.1-specific RT-PCR product was run on an agarose gel and transferred to nitrocellulose membrane and developed using a gene-specific RNA probe. This result demonstrates that PC5.1 transcription occurs, weakly, at 4-cell stage and indicates its maternal expression (data not shown) and is first detected by RT-PCR at 3hpf, 18hpf, and all the stages examined. In contrast to PC5.1, PC5.2 is expressed at varying levels. Numbers of cycles used for the PCR are indicated. No template (-) and actin were used as negative and positive controls, respectively. Gene-specific primers and amplicon sizes are listed in Supp. Figure S6. C: Western blot analysis using protein extracts from sets of 10 embryos each at 24hpf employing 10% SDS-PAGE. A 75-kDa protein product was detected for PC5.1 and 150- and 25-kDa species for PC5.2. Faint signals are also detected at about 50 kDa for both PC5.1 and PC5.2, suggesting the presence of splice variants.
|
