
Fig. 6
- ID
- ZDB-FIG-101104-56
- Publication
- Hui et al., 2010 - Cellular response after crush injury in adult zebrafish spinal cord
- Other Figures
- All Figure Page
- Back to All Figure Page
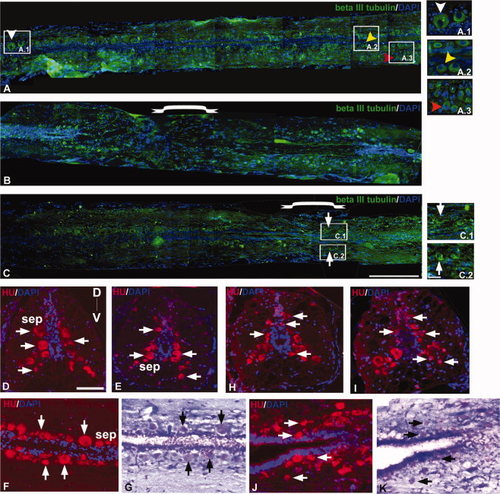
Immunohistochemical staining of β-III tubulin (A-C), Hu (D–F and H-J), and counter-staining of Luxol fast blue/Cresyl violet (G and K) in zebrafish uninjured (A, D–G) and injured spinal cord (B,C, and H–K). A: Section of uninjured cord shows the spatial distribution of different types of neurons sensory neurons (white ▼), interneurons close to ependyma (yellow ▼), and motorneurons (red ▼). A.1, A.2, A.3: Higher magnification of indicated areas of A showing different types of neurons. B: 3dpi cord section showing the loss of mature neurons at the injury epicenter. C: One month post-injured cord section showing regenerated neurons at the injury epicenter. C.1, C.2: Higher magnification of indicated areas in C, where formation of new neurons (thick arrow) both at the dorsal and ventral sides can be seen. D–F: Sections of uninjured cord showing the distribution of Hu+ neurons (thick arrow) in the subependyma (sep) along the D-V axis. G: Luxol fast blue/Cresyl violet staining of F. H–J: Sections from 10dpi cord showing the presence of Hu+ newly formed neurons (thick arrow) in different locations along the D-V axis. K: Staining of the same section in J with Luxol fast blue/Cresyl violet. Scale bar = 250 μm (A-C), 50 μm (A.1-A.3, C.1,C.2, D-K). |