
Fig. 8
- ID
- ZDB-FIG-101104-61
- Publication
- Hui et al., 2010 - Cellular response after crush injury in adult zebrafish spinal cord
- Other Figures
- All Figure Page
- Back to All Figure Page
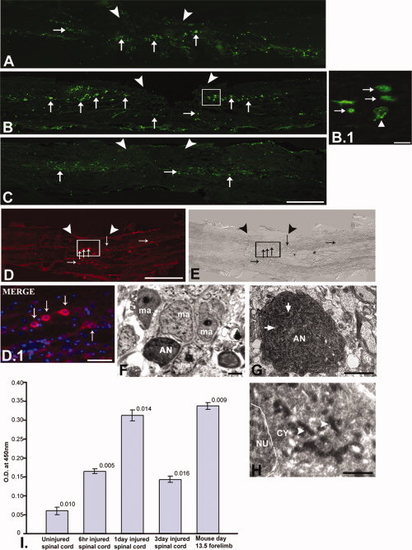
TUNEL staining (A-C), caspase-3 immunohistochemistry (D-E), ultrastructural analysis (F-H), and quantification of caspase-3 (I) in injured zebrafish spinal cord. A: The 6-hr post-injured spinal cord section shows the presence of apoptotic TUNEL-positive cells (thin arrow) both at the injury epicenter (▼▼) and immediate adjacent part. B: The 1dpi cord shows many TUNEL-positive cells (thin arrow) close to the injury epicenter. B.1: The higher magnification picture of B shows many apoptotic cells (thin arrow) and a cell with fragmented nuclear matter (up white arrowhead). C: The 3dpi cord section shows less TUNEL-positive cells (thin arrow) compared to 1dpi cord. D, E: 1dpi cord section shows the presence of many caspase-3-positive apoptotic cells (thin arrow) at the injury epicenter with respective DIC. D.1: Higher magnification of same section shows some caspase-3-positive cells (thin arrow). F-H: Representative pictures of different apoptotic neurons in 3dpi cord, showing apoptotic neuron (AN) surrounded by macrophages (ma, F), another showing a fragmented nucleus (thick arrow) and retracted cytoplasm (G), and a third showing dying mitochondria (right white arrowhead) within the cytoplasm (H). I: Quantification of caspase-3 protein in uninjured and injured zebrafish spinal cord. Mouse day-13.5 forelimb represented positive control. Scale bar = 200 μm (A-E), 50 μm (D.1), 10 μm (B.1), 2 μm (F,G), 1 μm (H). |