
Fig. S1
- ID
- ZDB-FIG-101104-62
- Publication
- Hui et al., 2010 - Cellular response after crush injury in adult zebrafish spinal cord
- Other Figures
- All Figure Page
- Back to All Figure Page
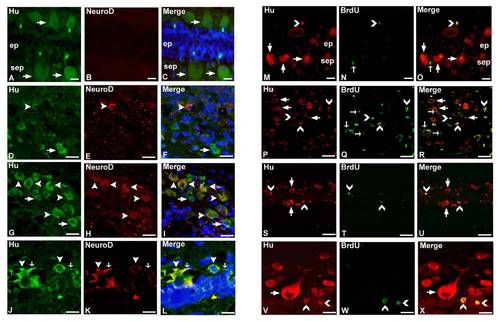
Quantitative analysis of GFAP/BrdU/DAPI expressing cells in whole spinal cord (equivalent to 4 mm length) before and after giving injury. Supp. Fig. S2. Immunohistochemical colocalization of Hu/NeuroD (A-L) and Hu/BrdU (M-X) in zebrafish spinal cord. A-C: Adult uninjured spinal cord section shows many Hu+ cells (→) in subependyma (sep) but are NeuroD-. D-F: The injury epicenter of a 10dpi cord shows Hu+ cells (→) and some of them are colocalized with NeuroD (▼). G–I: Colocalization of Hu and NeuroD (▼) can be seen in the immediate adjacent part of the injury epicenter in the same day cord. J-L: The immediate adjacent part of the injury epicenter of 10dpi cord also shows Hu+/NeuroD+ cells (▼) with small projections (↓). M-O: Uninjured cord section shows many Hu+ cells (→) in subependyma (sep); very few of them are BrdU+ (). P–U: Injury epicenter (P–R) and adjacent normal part (S–U) of the 7dpi cord, both showing Hu+/BrdU- (→), Hu/BrdU+ () and Hu+/BrdU+ () cells. Note that Hu+/BrdU+ cells are small and round shaped and are newly formed neurons. V-X: Higher magnification picture of the immediate adjacent part of the injury epicenter in 7dpi cord showing similar morphological characteristics of Hu+/BrdU+ cells. Scale bar = 10 μm (A-C, M-O), 20 μm (D-I), 40 μm (P-U), 5 μm (J-L, V-X). |