
Fig. 3
- ID
- ZDB-FIG-101103-23
- Publication
- Vermot et al., 2009 - Reversing blood flows act through klf2a to ensure normal valvulogenesis in the developing heart
- Other Figures
- All Figure Page
- Back to All Figure Page
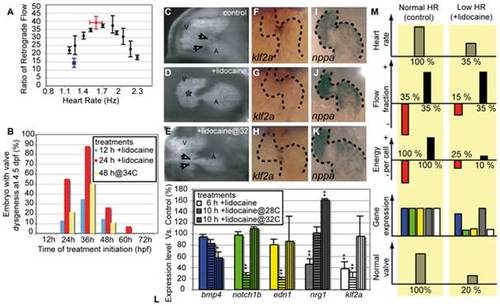
Decreased oscillatory flow decreases klf2a expression. (A) RFF is decreased by alterations in heart rate. The highest RFF is seen at the control heart rate (>30% between 1.5 and 2 Hz) at 48 hpf. Raising fish at lowered or elevated temperatures slows or speeds heart rate and significantly decreases RFF. Lidocaine treatment decreases heart rate and RFF (blue data point). The decreased heart rate and RFF is rescued by elevating the temperature to 34°C (red data point). (B) Decreased RFF from treatment with lidocaine or with high-temperature (34°C) leads to valve defects. The maximal effect is observed when treatment is initiated at 36 h. (C–E) Valve formation in normal and lidocaine treated embryos. (C) Embryos that were raised in control conditions have valve leaflets (white arrows). (D) Embryos in which RFF was decreased by lidocaine treatment from 31 to 55 hpf have endocardial tissue thickening (asterisk) but no valve leaflets are apparent (50%, n = 36). (E) Heart valve dysgenesis in fish exposed to 0.15% lidocaine for 24 h is rescued by incubating it at 34°C to restore normal RFF. Heart valve leaflets are present and function normally (white arrows). All embryos are imaged at 96 hpf. A, atrium; V, ventricle. (F–H) klf2a expression in 46-hpf-old embryos is altered by lidocaine treatment. (F) klf2a expression is localized at the AV boundary in control embryos. (G) klf2a expression decreases after 15-h lidocaine treatment (90%, n = 67). (H) Restoring heart rate and RFF to normal by raising the fish at 34°C restores klf2a expression (90%, n = 45). Anterior to the top. (I–K) nppa expression remains largely unaffected by lidocaine treatment and temperature rescue. (L) Quantitative RT-PCR showing the expression level of several flow-responsive genes after lidocaine treatment. klf2a expression is significantly decreased after 6 and 10 h of treatment and is restored by incubation at 34°C; 100% of expression corresponds to a normal expression level. *p<0.05; **p<0.01, ANOVA. (M) Outline summarizing the experimental outcome of decreasing oscillatory flow by decreasing heart rate. The color code for gene expression is the same as in (L). |
| Genes: | |
|---|---|
| Fish: | |
| Conditions: | |
| Anatomical Terms: | |
| Stage: | Day 4 |