
Fig. 1
- ID
- ZDB-FIG-100809-3
- Publication
- Schröter et al., 2010 - Segment Number and Axial Identity in a Segmentation Clock Period Mutant
- Other Figures
- All Figure Page
- Back to All Figure Page
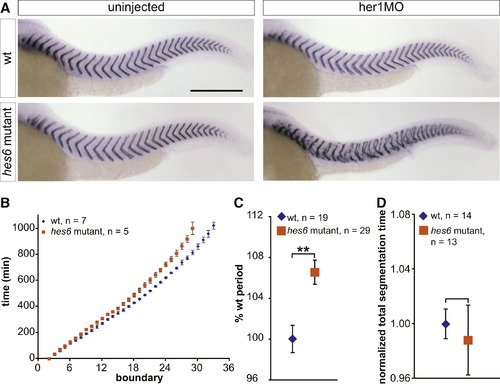
Mutating hes6 Slows Somitogenesis Period (A) Uninjected and her1MO-injected wild-type and hes6 mutant embryos were stained with a cb1045 riboprobe to analyze segmentation. Wild-type (upper left), hes6 mutant (lower left), and her1MO-injected wild-type embryos (upper right) segment grossly normally, but injecting her1MO into hes6 mutants disrupts segmentation (lower right). For segmentation phenotypes of hes6 morphants, see also Figure S1 and Table S1. The scale bar represents 0.3 mm. (B) To determine somitogenesis period along the entire axis, embryos were anesthetized with 0.02% tricaine and filmed in a multiple-embryo time-lapse array. Formation times of somite boundaries were read from the movies and normalized to the formation time of the second somite boundary for each individual. Data points show mean formation times ± standard deviation for each somite and genotype. Somitogenesis period is increased in hes6 mutant embryos along the entire axis, and hes6 mutants stop somitogenesis with a smaller number of segments. One representative experiment out of three independent trials is shown. (C) Trunk somitogenesis period was estimated from a linear fit to the data points corresponding to somites two through 18 in the somite number versus time plot. Data were pooled from three independent experiments by normalizing wild-type period to 100%. hes6 mutants segment ∼6.5% slower than their wild-type siblings. (D) Total segmentation time was calculated from time-lapse movies as the time span between formation of the second and the last visible somite boundary. Data are pooled from three independent experiments by normalizing the mean segmentation time of wild-type embryos to 1. Wild-type and hes6 mutant embryos segment for the same total amount of time. Data in (C) and (D) are displayed as mean ± 95% CI. **p d 0.001, Student′s t test. |
| Gene: | |
|---|---|
| Fish: | |
| Knockdown Reagents: | |
| Anatomical Term: | |
| Stage Range: | Prim-25 to Long-pec |
| Fish: | |
|---|---|
| Knockdown Reagents: | |
| Observed In: | |
| Stage Range: | Prim-25 to Long-pec |