
Fig. 4
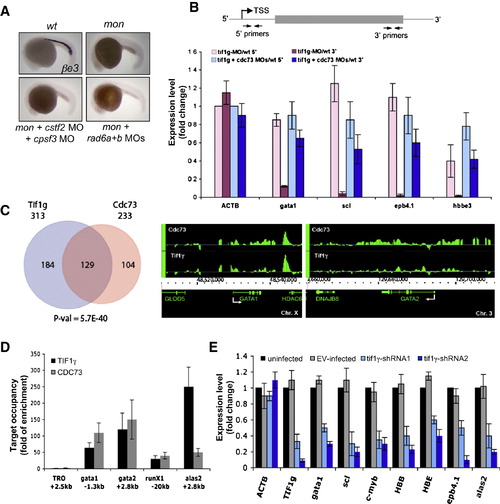
tif1γ Deficiency Reduces the Level of Full-Length Transcripts of Blood Genes (A) Morpholino knockdown of Rad6 and mRNA processing factors could not rescue βe3 globin expression in mon. In situ hybridization of βe3 globin was performed at 22 hpf. See also Figure S3. (B) Top: A schematic diagram showing the position of primers used in real-time RT-PCR analyses. Primers to detect the 5′ ends of transcripts are located within 120 bp from transcription start site (TSS), and primers for the 3′ ends of transcripts are in the 3′ coding region or 3′ untranslated region (UTR). Bottom: Real-time RT-PCR analyses to compare the level of 5′ (light pink and light blue) and 3′ (dark pink and dark blue) transcripts of selected genes between wild-type cells and morpholino knockdown cells. RNA was prepared as in Figure 3B. Results are shown as average fold change (mean ± SD) from three independent experiments, normalized to the level of the 5′ transcript of β-actin. (C) TIF1γ and CDC73 share common gene targets. Left: ChIP-Chip in K562 cells revealed a subset of gene targets shared between TIF1γ and CDC73. The significance of overlapping was evaluated by a hypergeometric distribution test. Right: ChIP-Chip at gata1 and gata2 locus. The transcription direction was indicated by white arrows. The raw dataset is available on NCBI′s GEO database under the accession number GSE20428. (D) TIF1γ and CDC73 ChIP in human CD34+ cells after 5 days of erythroid differentiation (proerythroblast stage). Results were normalized to the background level that was determined by ChIP without antibody. An inactive gene TRO (tropinin) was used as the negative control. The results are shown as mean ± SD from three independent experiments. (E) Real-time RT-PCR to compare erythroid gene expression between uninfected and infected CD34+ cells with indicated shRNA constructs. EV: empty vector. Data are represented as fold change relative to expression levels in uninfected cells. The results are shown as mean ± SD from three independent experiments. |
| Genes: | |
|---|---|
| Fish: | |
| Knockdown Reagents: | |
| Anatomical Term: | |
| Stage: | 10-13 somites |
| Fish: | |
|---|---|
| Knockdown Reagents: | |
| Observed In: | |
| Stage: | 10-13 somites |
Reprinted from Cell, 142(1), Bai, X., Kim, J., Yang, Z., Jurynec, M.J., Akie, T.E., Lee, J., LeBlanc, J., Sessa, A., Jiang, H., DiBiase, A., Zhou, Y., Grunwald, D.J., Lin, S., Cantor, A.B., Orkin, S.H., and Zon, L.I., TIF1gamma controls erythroid cell fate by regulating transcription elongation, 133-143, Copyright (2010) with permission from Elsevier. Full text @ Cell