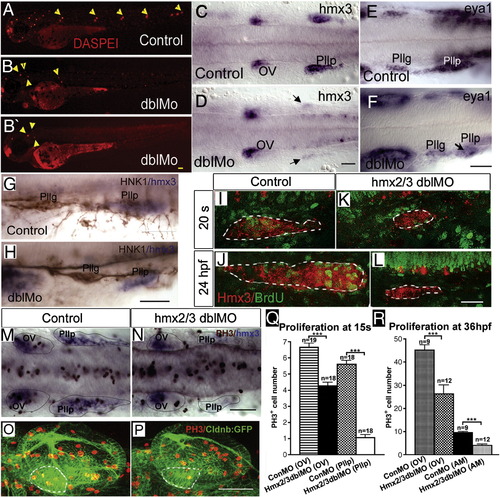
Lateral line development and cell proliferation in hmx2/hmx3 morphant embryos. All images are anterior to the left in lateral view (A, B, B′, G, H, I–L, O, P) or dorsal view (C–F, M, N). DASPEI staining of 3dpf embryos in control (A) and morphant embryos (B, B′) showing reduced number of neuromasts (yellow arrowheads) in hmx2/hmx3 morphants; (C) control and (D) morphant expression of hmx3 at 24 hpf, (E) control and (F) morphant expression of eya1 at 24 hpf; (G) control and (H) morphant embryos stained with anti-HNK1 (brown) and hmx3 (blue); (I–L) BrdU incorporation, (I, J) control and (K, L) morphant posterior lateral line primordium labeled with hmx3 (red) and BrdU (green); (M, N) double labeling of hmx3 (blue) with anti-PH3 (brown) at 15 somites in control (M) and morphants (N), showing reduced number of anti-PH3-positive cells in the hmx3 expression domain (highlighted with dotted line); (O, P) anti-PH3 (red) labeling of proliferating cells in the otic vesicle (OV) of control (O) and morphant embryo (P), in CldnB:lynGFP transgenic line. Dotted line outlines the anterior maculae (AM) region in both panels. Scale bar: 50 μm. (Q) Quantification of PH3-positive cells in hmx3 expression domain represented in panels M and N. Numbers of PH3-positive cells are 6.67 ± 1.20 in control OV; 4.28 ± 0.88 in hmx2/hmx3 morphant OV; 5.6 ± 1.0 in control Pllp and 1.0 ± 0.82 in morphant Pllp at 15 s. (R) Quantification of PH3-positive cells in the OV and AM, respectively, in control and morphant embryos. The number of proliferating cells was counted from the confocal stacks and quantified. Number of PH3-positive cells are 45.2 ± 2.18 in control OV, 26.2 ± 3.87 in morphant OV; 9.56 ± 0.41 in control AM, 4.08 ± 0.53 in morphant AM. Sample size (n = ) is indicated. Student test (t) is used to compare the control and morphant samples in Excel and error bars represent the standard deviation in each sample set. Abbreviation: AM, anterior maculae; OV, otic vesicle; s, somite.
|
