
FIGURE
Fig. 40
- ID
- ZDB-FIG-091217-31
- Publication
- Parichy et al., 2009 - Normal table of postembryonic zebrafish development: Staging by externally visible anatomy of the living fish
- Other Figures
-
- Fig. 1
- Fig. 2
- Fig. 5
- Fig. 6
- Fig. 8
- Fig. 10
- Fig. 11
- Fig. 13
- Fig. 14
- Fig. 16
- Fig. 17
- Fig. 18
- Fig. 19
- Fig. 21
- Fig. 22
- Fig. 23
- Fig. 24
- Fig. 25
- Fig. 26
- Fig. 27
- Fig. 28
- Fig. 32
- Fig. 33
- Fig. 34
- Fig. 35
- Fig. 36
- Fig. 37
- Fig. 38
- Fig. 39
- Fig. 40
- Fig. 41
- Fig. 42
- Fig. 43
- Fig. 44
- Fig. 45
- Fig. 46
- Fig. 47
- Fig. 48
- Fig. 49
- Fig. 50
- Fig. 51
- Fig. 52
- Fig. 53
- Fig. 54
- Fig. 55
- Fig. 56
- Fig. 57
- All Figure Page
- Back to All Figure Page
Fig. 40
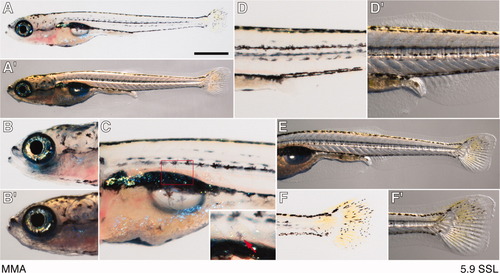
Metamorphic melanophore appearance; MMA, 5.9 mm SL (standard length). A,A′: Whole body. Scale bar = 1 mm. B,B′: Head. C: Anterior, showing first metamorphic melanophore over ventrolateral myotome (arrow in inset). D,D′: Posterior trunk, where metamorphic melanophores have not yet arisen. E: Caudal region. F,F′: Posterior tail. |
Expression Data
Expression Detail
Antibody Labeling
Phenotype Data
Phenotype Detail
Acknowledgments
This image is the copyrighted work of the attributed author or publisher, and
ZFIN has permission only to display this image to its users.
Additional permissions should be obtained from the applicable author or publisher of the image.
Full text @ Dev. Dyn.