|
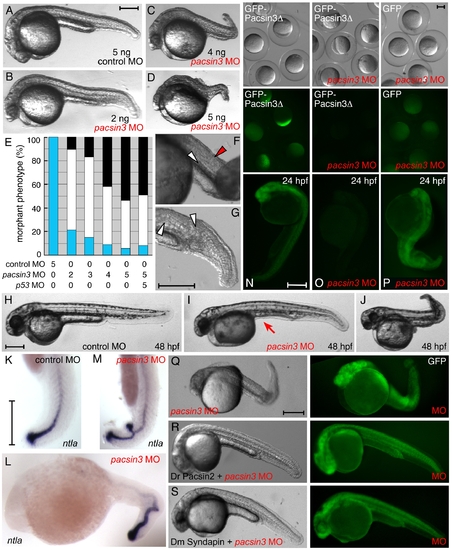
Inactivation of Pacsin 3 in zebrafish embryos. (A–D) Morphology of representative control (scrambled) or pacsin3 MO-injected 24 hpf embryos. Anterior is left. Bar = 250 μm. (E) Phenotypic quantitation of normal (blue), mild (white), or severely (black) affected embryos injected with control (n = 42) or 2 ng (n = 48), 3 ng (n = 53), 4 ng (n = 57), or 5 ng (n = 54) pacsin3 MO, or with both 5 ng pacsin3 and 5 ng p53 MOs (n = 61). (F–G) Close-up views of abnormal notochord (white arrowheads) and improperly structured somites (red arrowhead) in 24 hpf pacsin3 MO-injected embryos. Bar = 250 μm. (H–J) Representative lateral views of control or pacsin3 MO-injected 48 hpf embryos. Note lack of the yolk tube (arrow) even in mildly affected pacsin3 morphants. Bar = 250 μm. (K–M) Localization of ntla mRNA in typical control or pacsin3 MO-injected 24 hpf embryos. Anterior is up in K and M. Bar = 250 μm. (N–P) GFP fluorescence from injection of 25 pg GFP-Pacsin3Δ (N, O) or GFP (P) mRNA into embryos together with no (N) or 5 ng pacsin3 MO (O, P) at the one-cell stage. Groups of embryos still within the chorion at ∼5 hpf and typical individual 24 hpf embryos show effective and selective silencing of the pacsin3 transcript. Bar = 250 μm. (Q–S) Gross morphology of 3 ng pacsin3 MO-injected embryos co-injected with 50 pg GFP (Q) or 50 pg GFP and either 25 pg D. rerio Pacsin2 (R) or D. melanogaster Syndapin (S) mRNA. Bar = 250 μm.
|