
Fig. 7
- ID
- ZDB-FIG-091217-128
- Publication
- Edeling et al., 2009 - Structural requirements for PACSIN/Syndapin operation during zebrafish embryonic notochord development
- Other Figures
- All Figure Page
- Back to All Figure Page
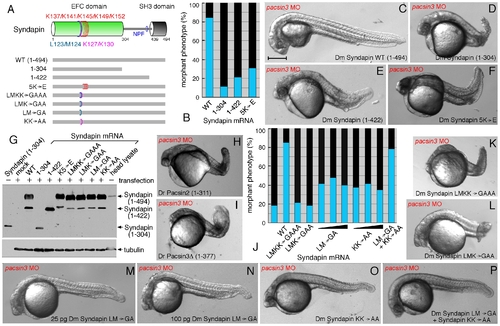
Structural requirements for Syndapin operation. (A) Schematic depiction of the various Syndapin mutants analyzed. (B) Quantitative phenotypic analysis of normal (blue) or abnormal (black) pacsin3 (3 ng MO) morphants coinjected with 25 pg Syndapin WT (n = 185) or Syndapin 1–305 (n = 97), 1–423 (n = 98) or 5K′E (n = 121) mutant mRNAs. Bar = 250 μm. (C–F) Representative images of the phenotype of 24 hpf pacsin3 MO embryos expressing the indicated Syndapin proteins. (G) Immunoblot analysis of expression of various Syndapin fragments and mutants from transfected pCS2+ in HeLa cells. The anti-Syndapin serum recognizes the EFC domain; as positive controls, purified Syndapin (1–304) and a Drosophila head lysate containing endogenous Syndapin were used. (H–I) Representative images of pacsin3 MO embryos also expressing D. rerio Pacsin2 or Pacsin3 SH3Δ proteins. (J) Quantitative phenotypic analysis of normal (blue) or abnormal (black) pacsin3 (3 ng MO) morphants alone (n = 50) or coinjected with 25 pg Syndapin WT (n = 185), LMKK→GAAA (n = 119), LMK→GAA (n = 99), LM→GA (n = 95; 50 pg, n = 48; 100 pg, n = 43), KK→AA (n = 122; 50 pg, n = 57; 100 pg, n = 76) or 25 pg of both the LM→GA and KK→AA (n = 115) mutant Syndapin mRNAs. (K–P) Representative images of the phenotype of pacsin3 MO embryos expressing the indicated Syndapin proteins. |