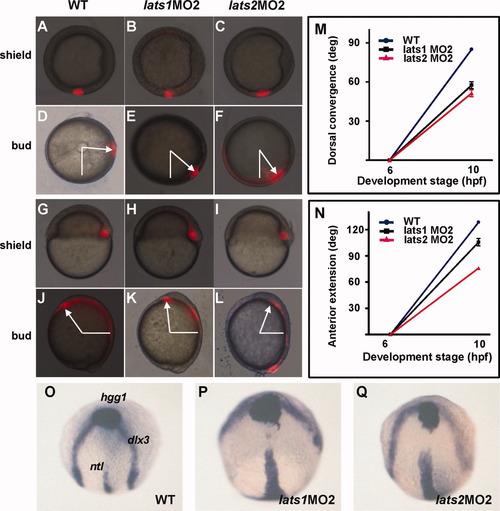
lats1 and lats2 morphants showed convergence extension defects during gastrulation. Embryos were injected with indicated morpholino (MO)and kaede mRNA. A-L: The Kaede protein was photoconverted at shield stage (6 hours postfertilization [hpf]) laterally to determine dorsal migration (A-F; animal pole view, dorsal to right) and dorsally to determine anterior extension (G-L; lateral view, dorsal to right). Images show photoconverted cells directly after activation (A-C,G-I), and at bud stage (D-F,J-L). White arrows indicated dorsal convergence (D-F; n = 5, 9, and 9, respectively) and anterior extension (J-L; n = 4, 7, 8, respectively). M,N: Graphs that compare the dorsal convergence (M) and anterior extension (N) of labeled cell groups in the embryos at bud stage were shown in (D,J: control, blue), (E,K: lats1MO2, black), (F,L: lats2MO2, red). Dorsal convergence and anterior extension were quantified by the position of the labeled cells at the indicated stage. The mean and standard deviation (SD) were shown. The results shown in A-L represent the result of one experiment. The doses of kaede mRNA, lats1MO2 and lats2 MO2 are 500 pg, 3.3 ng, and 5 ng per embryo, respectively. O-Q: The molecular description of defective convergence extension (CE) movements in lats1 and lats2 morphants. H,I: All the embryos were at the three- to four-somite stage. In the lats1 (H) and lats2 (I) morphants, the posters labeled by hgg1 were far behind the anterior border of the neural plates that was labeled by dlx3. G,H: The neural plates indicated by the distance between dlx3 labeling in lats1 (H) and lats2 (I) morphants were much wider than that in wild-type embryos (G). Embryos in (A-F) were animal pole view with dorsal to the right, embryos in (G-L) were lateral view with dorsal to the right, and embryos in (O-Q) were dorsal view with anterior to the top. deg, degree.
|

