
FIGURE
Fig. 7
- ID
- ZDB-FIG-090915-16
- Publication
- Lepiller et al., 2009 - Comparative analysis of zebrafish nos2a and nos2b genes
- Other Figures
- All Figure Page
- Back to All Figure Page
Fig. 7
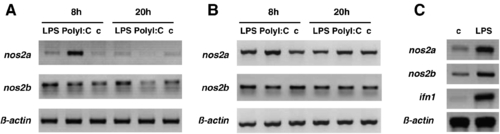
Induction of nos2a and nos2b gene expression. ZFL (A) or ZF4 (B) cell lines remained unstimulated (c) or were stimulated with LPS or PolyI:C for 8 or 20 h. Adult zebrafish (C) were challenged with LPS (5 μg in 50 μL) or PBS (as a negative control). Total RNA from cells or site of injection was reversed-transcribed and amplified to detect nos2a, nos2b, ifn1 and the β-actin control. |
Expression Data
| Genes: | |
|---|---|
| Fish: | |
| Condition: | |
| Anatomical Term: | |
| Stage: | Adult |
Expression Detail
Antibody Labeling
Phenotype Data
Phenotype Detail
Acknowledgments
This image is the copyrighted work of the attributed author or publisher, and
ZFIN has permission only to display this image to its users.
Additional permissions should be obtained from the applicable author or publisher of the image.
Reprinted from Gene, 445(1-2), Lepiller, S., Franche, N., Solary, E., Chluba, J., and Laurens, V., Comparative analysis of zebrafish nos2a and nos2b genes, 58-65, Copyright (2009) with permission from Elsevier. Full text @ Gene