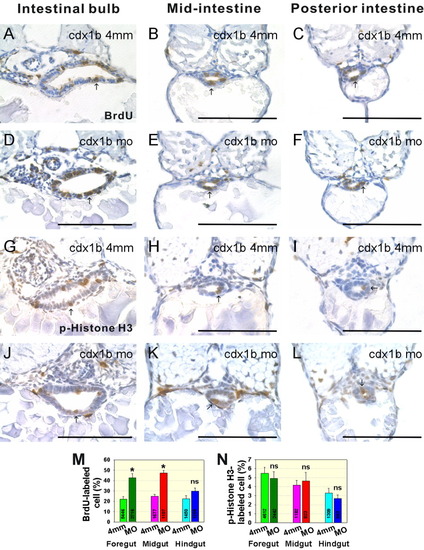
Cell proliferation affected in cdx1b morphants. A-F: BrdU-labeled paraffin transverse sections corresponding to the intestinal bulb (A, D), mid-intestine (B, E), and posterior-intestine (C, F) of respective 72-hr post-fertilization (hpf) cdx1b-4mm-MO-injected (A-C) and cdx1b MO-injected (D-F) embryos. Arrows indicate BrdU-labeled cells. G-L: p-Histone H3-stained cryostat transverse sections corresponding to intestinal bulb (G, J), mid-intestine (H, K), and posterior-intestine (I, L) of respective 72-hpf cdx1b-4mm-MO-injected (G-I) and cdx1b MO-injected (J-L) embryos. Arrows indicate p-Histone H3-stained cells. M: Comparison of the percentages of BrdU-labeled cells in the intestinal bulb, mid-intestine, and posterior-intestine of cdx1b-4mm-MO-injected (n=8) and cdx1b MO-injected (n=9) embryos. N: Comparison of the percentages of p-Histone H3-stained cells in the intestinal bulb, mid-intestine, and posterior-intestine of cdx1b-4mm-MO-injected (n = 5) and cdx1b MO-injected (n = 6) embryos. Total cell number counted for intestinal bulb, mid-intestine, and posterior intestine of both 72-hpf cdx1b -4mm-MO-injected and cdx1b MO-injected embryos are shown. Error bars indicate standard errors. *P < 0.001. Ns, not significant. Scale bars = 100 μm.
|
