
Fig. 2
- ID
- ZDB-FIG-090401-27
- Publication
- Gomez et al., 2009 - Discovery and characterization of novel vascular and hematopoietic genes downstream of etsrp in zebrafish
- Other Figures
- All Figure Page
- Back to All Figure Page
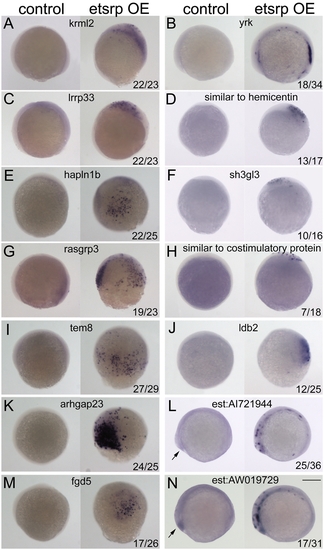
Ectopic induction of microarray identified genes by etsrp overexpression. Ectopic gene expression was examined at 80% epiboly to tailbud stages in flk1:gfp transgenic embryos injected with 30 pg etsrp-mcherry DNA at the one cell stage. Embryos exhibiting both red and green fluorescence were selected for analysis. Representative control embryos are on the left and etsrp overexpressing (OE) embryos are on the right side of each panel. Represented genes: (A) krml2; (B) yrk; (C) lrrp33; (D) similar to hemicentin; (E) hapln1b; (F) sh3gl3; (G) rasgrp3; (H) similar to costimulatory protein; (I) tem8; (J) ldb2; (K) arhgap23; (L) est:AI721944; (M) fgd5; and (N) est:AW019729. Note that there is a low level of endogenous expression in the control embryos for the two EST's, L and N, at the polster (arrows). Ratios in bottom right hand corner in panels represent the number of embryos with ectopic induction of total embryos processed and scored in the injected groups; control embryos never displayed ectopic induction. All embryos are in lateral view, and those at tail bud stage are oriented with anterior to the left. Scale bar: 250 μm. |