Fig. 2
- ID
- ZDB-FIG-090310-1
- Publication
- Buckles et al., 2004 - Combinatorial Wnt control of zebrafish midbrain-hindbrain boundary formation
- Other Figures
- All Figure Page
- Back to All Figure Page
|
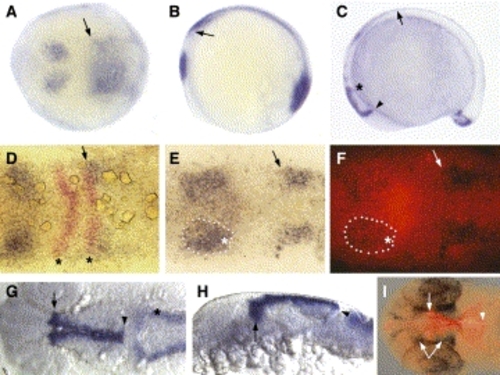
Expression pattern of zebrafish wnt3a. (A,B) 3-somite stage. (C) 14-somite stage, lateral view. (D–F) 3-somite stage (G–I) 24–27 hpf. All panels, anterior is to the left. (A) Dorsal view. (B) Lateral view of the same embryo as in A. wnt3a transcripts are observed in the prospective midbrain, the hindbrain (arrow) and the tailbud (visible in panel B). (C) Expression now extends ventrally in the diencephalon (arrowhead) and to a lesser extent at the MHB (asterisk). Expression in the dorsal neural tube (arrow) has strengthened and extends from the rostral hindbrain to the tailbud. Tailbud expression has resolved into a stronger dorsal domain and weaker ventral domain. (D) Double in situ for wnt3a (blue) and krox20 (red). Dorsal views focused the midbrain–hindbrain region. Asterisks indicate r3 and r5 krox20, arrow points out overlap of r5 krox20 with anterior limit of hindbrain wnt3a. (E,F) Double in situ for wnt3a (blue) and pax2a (red fluorescence in panel (F)). Same view as in (D). Dotted line indicates same wnt3a midbrain expression domain in both panels. Asterisk indicates where wnt3a overlaps with the lateral portion of pax2a. Arrow indicates anterior limit of hindbrain domain. (G) Dorsal view centered on the midbrain. Arrow indicates anterior wnt3a limit in G–I, which resides in the diencephalon. Arrowhead indicates posterior limit of midbrain expression. Asterisk indicates rhombic lip/cerebellar expression. (H) Lateral view of embryo in (G). Note ventral extension in the diencephalon (arrow), but expression is restricted dorsally at the MHB (arrowhead). (I) Double in situ for wnt3a (red fluorescence) and pax6 (blue). Dorsal view focused on midbrain. Forked arrow indicates two diencephalic expression domains of pax6. wnt3a expression terminates between those two domains. |
| Genes: | |
|---|---|
| Fish: | |
| Anatomical Terms: | |
| Stage Range: | 1-4 somites to Prim-5 |
Reprinted from Mechanisms of Development, 121(5), Buckles, G.R., Thorpe, C.J., Ramel, M.C., and Lekven, A.C., Combinatorial Wnt control of zebrafish midbrain-hindbrain boundary formation, 437-447, Copyright (2004) with permission from Elsevier. Full text @ Mech. Dev.

