
- Title
-
Combinatorial Wnt control of zebrafish midbrain-hindbrain boundary formation
- Authors
- Buckles, G.R., Thorpe, C.J., Ramel, M.C., and Lekven, A.C.
- Source
- Full text @ Mech. Dev.
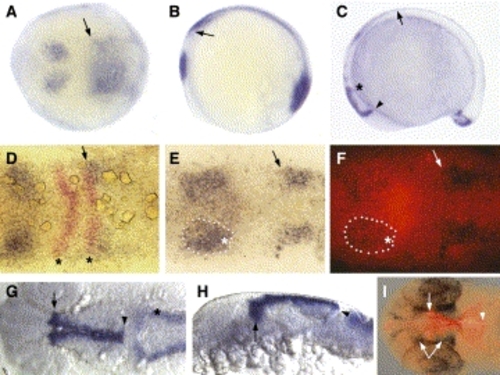
Expression pattern of zebrafish wnt3a. (A,B) 3-somite stage. (C) 14-somite stage, lateral view. (D–F) 3-somite stage (G–I) 24–27 hpf. All panels, anterior is to the left. (A) Dorsal view. (B) Lateral view of the same embryo as in A. wnt3a transcripts are observed in the prospective midbrain, the hindbrain (arrow) and the tailbud (visible in panel B). (C) Expression now extends ventrally in the diencephalon (arrowhead) and to a lesser extent at the MHB (asterisk). Expression in the dorsal neural tube (arrow) has strengthened and extends from the rostral hindbrain to the tailbud. Tailbud expression has resolved into a stronger dorsal domain and weaker ventral domain. (D) Double in situ for wnt3a (blue) and krox20 (red). Dorsal views focused the midbrain–hindbrain region. Asterisks indicate r3 and r5 krox20, arrow points out overlap of r5 krox20 with anterior limit of hindbrain wnt3a. (E,F) Double in situ for wnt3a (blue) and pax2a (red fluorescence in panel (F)). Same view as in (D). Dotted line indicates same wnt3a midbrain expression domain in both panels. Asterisk indicates where wnt3a overlaps with the lateral portion of pax2a. Arrow indicates anterior limit of hindbrain domain. (G) Dorsal view centered on the midbrain. Arrow indicates anterior wnt3a limit in G–I, which resides in the diencephalon. Arrowhead indicates posterior limit of midbrain expression. Asterisk indicates rhombic lip/cerebellar expression. (H) Lateral view of embryo in (G). Note ventral extension in the diencephalon (arrow), but expression is restricted dorsally at the MHB (arrowhead). (I) Double in situ for wnt3a (red fluorescence) and pax6 (blue). Dorsal view focused on midbrain. Forked arrow indicates two diencephalic expression domains of pax6. wnt3a expression terminates between those two domains. EXPRESSION / LABELING:
|
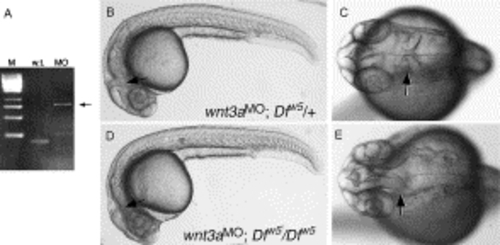
Loss of the isthmic constriction in embryos lacking Wnt3a, Wnt1 and Wnt10b. (A) RT-PCR analysis of wnt3a splice-blocking MO activity. The wild-type product (w.t.) is 168 bp. The morpholino blocks splicing of intron 1, leading to the predicted 810 bp PCR product (MO, arrow). (B–E) Live embryos at 27 hpf, anterior to the left. (B,C) Wild type phenotype observed in ∼75% of wnt3a MO injected embryos derived from a Dfw5/+intercross. The isthmic constriction (arrow) is easily seen in the dorsal view of the head in (C). (D,E) MHB-absent phenotype observed in ∼25% of injected embryos. Note the wild type appearance of the animal except for the loss of the isthmic constriction (arrows). PHENOTYPE:
|
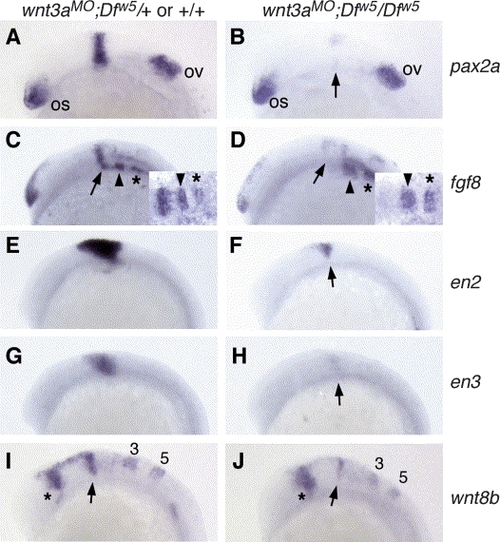
Marker expression in 12-somite stage wnt3aMO;Dfw5/Dfw5 embryos. All panels are lateral views, anterior to the left. The in situ probe used is indicated to the right of each row, and the embryonic genotype is indicated above each column. (A,B) Note the strong reduction in pax2a in wnt3aMO;Dfw5/Dfw5 embryos in the MHB (arrow), while the optic stalk (os) and otic vesicle (ov) expression are unaffected. (C,D) fgf8 is expressed in the MHB (arrows), r2 (arrowheads) and r4 (asterisks). Note specific reduction of MHB fgf8 expression in wnt3aMO;Dfw5/Dfw5 embryos. Insets: dorsal views focused on MHB region, anterior left. (E,F) en2 expression is strongly reduced or absent in wnt3aMO;Dfw5/Dfw5 embryos (arrow) as is en3 (arrow in H). Of note: en3 is not affected in Dfw5/Dfw5 embryos at this stage (Lekven et al., 2003). (I,J) wnt8b is variably reduced in the MHB of wnt3aMO;Dfw5/Dfw5 embryos (arrow), while the forebrain (asterisk), r3 and r5 domains (numbered) are not significantly different from wild type. |
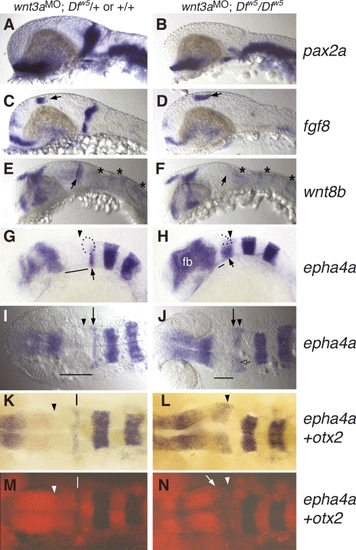
Loss of MHB gene expression in wnt3aMO;Dfw5/Dfw5 embryos at 24–27 hpf. In situ probes used are indicated to the right of each row. All panels: anterior to the right. (A–H) Lateral views. (I–N) Dorsal views. (A,C,E,G,I,K,M) Wild type or Dfw5/+embryos injected with wnt3a MO. (B,D,F,H,J,L,N) Dfw5 homozygous siblings injected with wnt3a MO. (A,B) pax2a is absent specifically in the MHB domain. Optic stalk and hindbrain neuron expression is unaffected. (C,D) fgf8 also is absent in the MHB of wnt3aMO;Dfw5/Dfw5 embryos, while dorsal diencephalon (arrows), heart, optic stalk and telencephalic expression is unaffected. (E,F) wnt8b expression in the MHB is completely absent. r1, r3 and r5 expression is still visible in wnt3aMO;Dfw5/Dfw5 embryos (asterisks), and r1 expression abuts the caudal edge of the midbrain (arrow). (G,H) Slightly oblique views. epha4a is normal in r3 and r5, but r1 expression is expanded in wnt3aMO;Dfw5/Dfw5 (arrow). In wild-type embryos, the cerebellum lies dorsal to the basal r1 domain (dotted outline), but this position in wnt3aMO;Dfw5/Dfw5 embryos (dotted line) is occupied by tissue that is not morphologically identifiable. Note also the reduced tegmentum (solid line) recognized as the space between r1 and forebrain (fb) domains of epha4a expression. Forebrain expression of epha4a is increased in some wnt3aMO;Dfw5/Dfw5 embryos, although this is variable among embryos. (I,J) Dorsal views to illustrate position of r1 epha4a stripe (arrow) in relation to the posterior edge of the midbrain (arrowhead). In (J), the arrow is placed at the anterior edge of epha4a. Note that the r1 epha4a domain lies underneath the dorsal brain tissue (open arrow). Lines indicate length of midbrain and rostral hindbrain region. (K–N) Double in situ hybridization for epha4a (blue) and otx2 (red). (K,L) Bright field image. (M,N) Fluorescent images (Fast red) of the embryos in K,L. Arrowheads indicate the caudal edge of otx2 expression. In wild-type, the space between otx2 and r1 epha4a expression (vertical lines in panels K,M) defines the region referred to as r0 by Waskiewicz et al. (2002), which includes the cerebellum anlage. Note the substantially reduced intensity of otx2 expression in the wnt3aMO;Dfw5/Dfw5 embryo, especially at its caudal edge (arrow in N), and the r1 epha4a domain sits below the caudal edge of otx2. Arrowheads in (G–N) indicate equivalent positions, which is the posterior edge of otx2 expression in each genotype. PHENOTYPE:
|
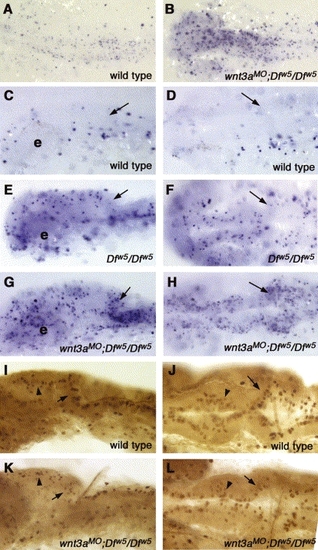
Wnt signaling is required to inhibit apoptosis in the brain. (A–H) TUNEL assays to detect apoptosis. (I–L) Assays of phospho-histone H3 labeling. All panels; anterior is to the left, genotype is indicated in lower right corner. (A,B) 18-somite stage embryos, dorsal view. Substantially increased numbers of apoptotic cells are observed. (C,E,G) Lateral views and (D,F,H) dorsal views of 24 hpf embryos. (C,D) Wild type embryos have very little cell death at this stage. e: eye. (E,F) Consistent with our previous report (Lekven et al., 2003), Dfw5/Dfw5 embryos have increased apoptosis in the tectum, but not in the cerebellum (arrows in C–L indicate cerebellum). (G,H) wnt3aMO;Dfw5/Dfw5 embryos have greatly elevated levels of apoptosis in the midbrain and cerebellum. (I,K) Lateral views and (J,L) dorsal views of 24 hpf embryos labeled for phospho-histone H3. (I,J) Wild type embryos have regular rows of mitotic cells at the dorsal midline of the midbrain (arrowheads) and in the rhombic lip (arrows). (K,L) wnt3aMO;Dfw5/Dfw5 embryos occasionally have reduced numbers of mitotic cells in these locations. PHENOTYPE:
|
Reprinted from Mechanisms of Development, 121(5), Buckles, G.R., Thorpe, C.J., Ramel, M.C., and Lekven, A.C., Combinatorial Wnt control of zebrafish midbrain-hindbrain boundary formation, 437-447, Copyright (2004) with permission from Elsevier. Full text @ Mech. Dev.