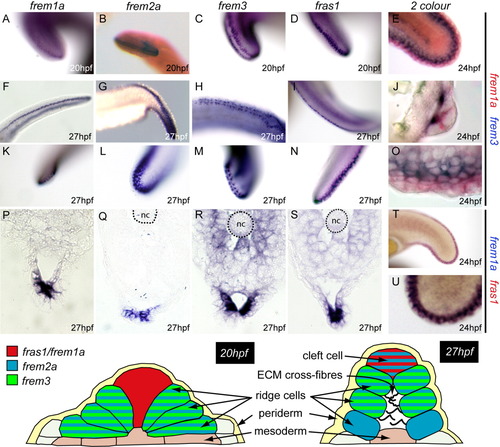
Expression of the frem and fras genes during median fin morphogenesis. Upper panel: Expression of the frem/fras genes in the developing fin fold. At 20 hours postfertilization (hpf), expression of frem1a and fras1 are detected in a midline stripe of cells (A,D), whereas frem3, and to a lesser extend frem2a, are expressed in two complementary cell populations cells (B,C). At 27 hpf, this pattern of complementary expression is continued, although frem2a is now expressed in both medial and lateral cell populations (F-I, dorsal/ventral; K-N, posterior. Dual in situ hybridization confirms complementary expression of frem3 and frem1a (E, lateral; J, section; O, lateral) and co-expression of frem1a and fras1 (T,U). Sections of embryos at 27 hpf confirm the observation made in whole embryos (P-S, caudal fold). Lower panel: We propose a model of complementary and overlapping gene expression, which corresponds to ridge and cleft cell populations first identified morphologically by Dane and Tucker,[1985]. nc, notochord.
|
