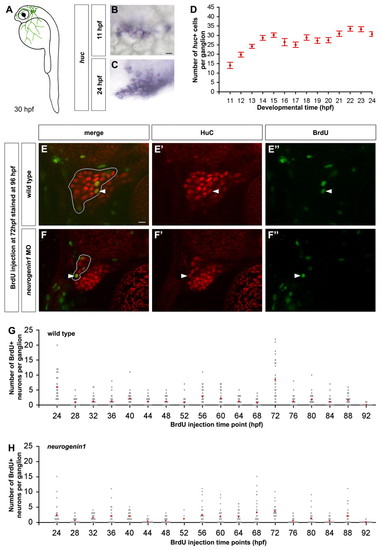
Continuous neurogenesis in the zebrafish trigeminal sensory ganglia. (A) As schematized in a 30 hpf zebrafish embryo, the trigeminal sensory ganglia (green) are located on each side of the head posterior to the eyes. Trigeminal sensory neurons innervate the head and part of the yolk. (B-D) Wild-type embryos were hybridized with a huc antisense probe to count the number of trigeminal sensory neurons per ganglion. The first neurons appear at 11 hpf forming small clusters (B). During subsequent development, the number of neurons per ganglion increases (C). Side view, anterior towards the left; red asterisks label single neurons. Scale bar: 10 μm. The graph represents the average number of neurons per ganglion at different developmental stages ranging from 11 hpf to 24 hpf (D). An individual ganglion contains an average of 14 neurons at 11 hpf and reaches an average size of 30 neurons at 24 hpf. Error bars indicate s.e.m. (n=15). (E-H) To measure the number of neurons added to the trigeminal sensory ganglion after 24 hpf, embryos were injected once with BrdU, fixed at 96 hpf and immunostained for HuC (red) and BrdU (green). Double labeled cells in the trigeminal sensory ganglia of wild-type (E) or neurogenin1 morphant (F) embryos injected with BrdU at 72 hpf are indicated with a white arrowhead. Side view, anterior towards the left; white outline delimits the trigeminal sensory ganglion from the anterior lateral line. Scale bar: 10 μm. The graphs represent the number of neurons per ganglion born after the BrdU injection time point in wild-type (G) and neurogenin1 morphant (H) embryos. Injections were performed at different times ranging from 24 hpf to 92 hpf. Gray dots represent individual samples and red dots represent the average number of BrdU-positive trigeminal sensory neurons found per ganglion at each injection time point (n=30).
|
