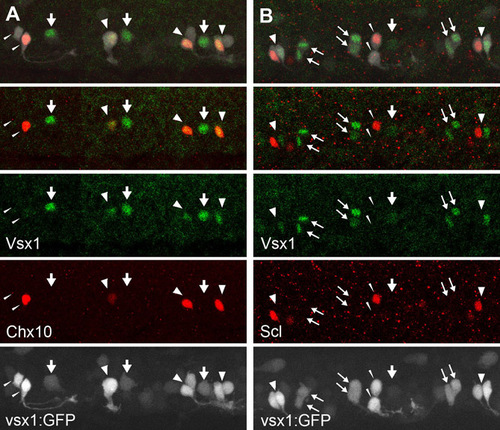
Vsx1 protein expression in the V2 neuron lineage. (A) Dual immunohistochemical staining of Vsx1 (green) and Chx10 (red) in a Tgvsx1:GFP (GFP signal is white) embryo at 20 hpf. (B) Dual immunohistochemical staining of Vsx1 (green) and Scl (red) in a Tgvsx1:GFP (GFP signal is white) embryo at 20 hpf. In both figures, the top panels show merged images of three channels (white, green and red), whereas the second panels from the top show merged images of two channels (green and red). Vsx1-expressing cells are either p2 intermediate progenitors or their progenies. For example, the single GFP cells marked by thick arrows probably correspond to p2 intermediate progenitors. Vsx1-expressing cells are also present as pairs (thin arrows). Each pair probably represents a sibling, and thus both of the progeny can express Vsx1. Often, however, Vsx1 expression is only present in one cell of the putative pair (fat arrowheads). In these cases, Vsx1-positive cells often co-express Chx10 (fat arrowheads in A), whereas Vsx1-expressing cells and Scl-expressing cells tend to make up pairs (fat arrowheads in B). These observations strongly suggest that Vsx1 protein expression occurs in the following manner in the V2 neuron lineage. First, Vsx1 protein expression is upregulated in p2 intermediate progenitors. After division, both progeny temporarily express Vsx1. The cells that will become V2b neurons (Scl positive) then lose Vsx1 expression, whereas the cells that will become V2a neurons continue to express Vsx1. We have also observed a pair of cells without detectable levels of Vsx1 in either cell (slim arrowheads; note that one of the cells expresses either Chx10 or Scl). These observations suggest that V2a neurons ultimately lose Vsx1 protein expression.
|
