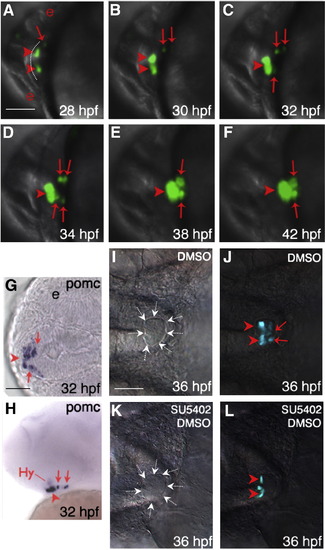
Temporally and spatially distinct POMC cell ontogeny in zebrafish pituitary. (A–F) In vivo time-lapse imaging of POMC-GFP expressing-cells in the pituitary anlage visualized using a Leica TCS SP confocal microscope from 28 to 42 hpf. Developmental stages are indicated at bottom right corner. POMC-GFP expressing cells are detected within the anterior most and lateral-posterior surface of ANR at 28 hpf (A), followed by asymmetric bilateral-posterior POMC cell differentiation and medio-posterior migration into the rostral pars distalis (RPD) and pars intermedia (PI). (G and H) in situ hybridization at 32 hpf using a POMC probe. Note the endogenous pituitary pomc expression pattern is similar to that of POMC-GFP transgene. (I–L) Treatment of POMC-GFP transgenic embryo with 10 μM SU5402 or DMSO between 22–26 hpf leads to diminished POMC-GFP cells in PI by 36 hpf visualized under a fluorescein isothiocyanate (FITC) filter on a Zeiss microscope. (I and K), DIC images showing pituitary anlage outlined by dashed arrows. (J and L), POMC-GFP fluorescent images superimposed onto DIC images. A–F and I–L: ventral view; G: ventral–frontal view; H: ventrolateral view (top, dorsal; bottom, ventral). All: left, anterior; right, posterior. Arrowhead: anterior-most or RPD POMC cells; arrow: lateral-posterior or PI POMC cells; Hy: hypothalamic POMC expressing cells. The anterior-most neural ridge surface is traced as a reference point in panel A. e, eye. Scale bars, 50 μm.
|
