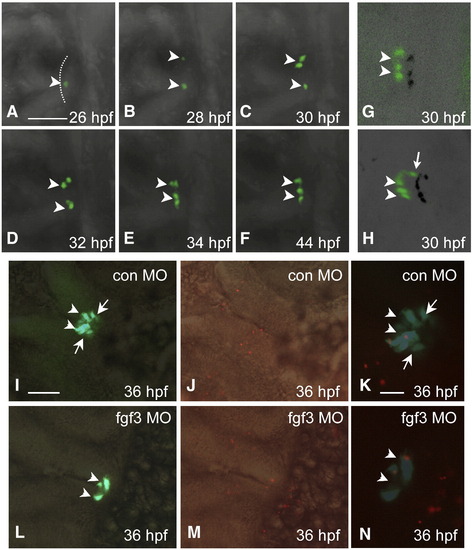
Loss of POMC cells in the pars intermedia of FGF3 morphants is associated with absent lineage induction. Developmental stages are indicated at bottom right corner. (A–F) In vivo time-lapse imaging of POMC-GFP expressing-cells in the pituitary anlage of an FGF3 morphant from 26 to 44 hpf. POMC-GFP expressing cells are detected within the anterior-most ANR surface but not the lateral–posterior areas during the entire process. (G and H) 3-D confocal microscopy image of POMC-GFP expressing-cells with shadow projections (black signals). The 3-D image further confirms lack of lateral-posterior POMC cells in the FGF3 morphant (G) compared with wild type embryos (H) at 30 hpf. (I–N) POMC-GFP cell apoptosis is unaffected in hypomorphic FGF3 morphants. DIC images of pituitary ventral views superimposed with fluorescent images of POMC-GFP (I and L), or TMR Red labeling of apoptotic cells in red (J and M). Fluorescent images of POMC-GFP superimposed with TMR Red cell labeling in red show occasional pituitary apoptotic cells in embryos injected with standard control MO (K) or FGF3 MO (N). Scale bar (A–J, L, M), 50 μm. (K and N), 20 μm. All ventral-frontal view; left, anterior; arrowhead: anterior-most POMC cells in ANR; arrow: lateral–posterior POMC cells. The anterior-most neural ridge surface is traced as a reference point in panel A.
|
