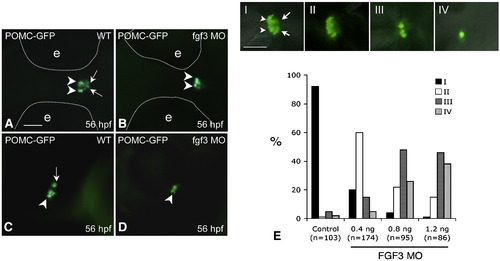
FGF3 dose-dependent regulation of POMC expression in the RPD and PI of zebrafish pituitary. 1–2 cell stage POMC-GFP transgenic embryos were injected with vehicle (A and C) or 0.4 ng/embryo of FGF3 MO (B and D) and then cultured in routine medium. At 56 hpf, POMC-GFP expression patterns were analyzed using fluorescent microscopy. For quantification, POMC-GFP transgenic embryos injected with 1 nL of FGF3 MO at increasing concentrations or 1.2 ng/embryo standard control MO were characterized under fluorescent microscopy and devided into 4 subgroups (E, I–IV) according to pituitary POMC-GFP phenotypes: Phenotype I, normal POMC-GFP expression in both the rostral pars distalis (arrowheads) and pars intermedia (arrow); Phenotype II, loss of POMC-GFP expression in the pars intermedia; Phenotype III, loss of POMC-GFP expression in the pars intermedia and partial loss in the rostral pars distalis (< 50% loss in pars distalis compared to I); Phenotype IV, loss of POMC-GFP expression in pars intermedia and rostral pars distalis (> 50% loss in pars distalis compared to panel I). Frequencies (%) of each phenotype corresponding to injections of standard control MO (1.2 ng) or FGF3 MO (0.4 ng, 0.8 ng or 1.2 ng) are analyzed and shown in panel E. Data are collected from two independent experiments. n, number of analyzed embryos. A–D: ventral view. left, anterior; right, posterior. Scale bar, 50 μm.
|
