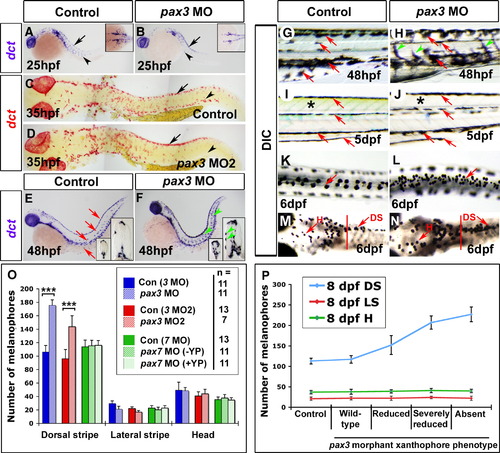
Delayed melanophore origin then increase correlate with xanthophore loss in pax3 morphants. Embryos analysed by in situ mRNA hybridisation for dct (A–F), live (G–J) or fixed (K–N) shown with anterior to left. Wholemounts are shown in lateral (A, B, E–J; dorsal to top) or dorsal (K–N) view. Whole embryo flatmounts (C, D) show dorsal and lateral views in head and trunk regions, respectively. (A, B) At 25 hpf, dct mRNA is detected in pre-migratory (arrows) and migrating melanoblasts (arrowheads) in the head and trunk, and also in the eye pigment epithelium. In pax3 morphants, dct+ melanoblasts are reduced, but still able to migrate (B, arrowhead). (C, D) At 35 hpf, substantially more dct+ melanoblasts are situated dorsally in pax3 MO2-injected embryos (arrows), but migrated dct+ melanoblasts are reduced (arrowheads). (E–H) At 48 hpf, dct mRNA is present in dorsal, lateral and ventral stripes, and in single cells on yolk sac, matching the melanophore pattern (E, G red arrows). In pax3 morphants, melanised and dct+ cells are more abundant between stripes on the medial and lateral pathways (F, H arrowheads). (I, J) At 5 dpf in control embryos, four larval melanophore stripes are clearly defined (I, red arrows) and the trunk has a yellow/green cast due to xanthophore pigmentation (I, asterisk). In pax3 morphants, the trunk is devoid of xanthophore pigmentation (J, asterisk), but the melanophore pattern is within normal variation (J, red arrows). (K-N) Treatment of 6 dpf embryos with adrenalin causes melanophore contraction that permits cell counting. In trunk (K, L) but not head (M, N anterior to red bar), pax3 MO-injection increases melanophore number in the dorsal stripe. (O) Quantification of melanophore number in pax3 MO, pax3 MO2 and pax7 MO-injected embryos at 6 dpf. pax7 morphants were categorised into normal yellow pigmentation (+ YP) or reduced yellow pigmentation (- YP) groups. ***p < 0.0001. (P) Correlation of melanophore increase in pax3 morphants with loss of xanthophores. Pax3 MO2-injected 8 dpf larvae were categorised by severity of methylene blue-stained xanthophore phenotype, and melanophores counted. DS = dorsal stripe, LS = lateral stripe, H = head melanophores.
|
