
Fig. 2
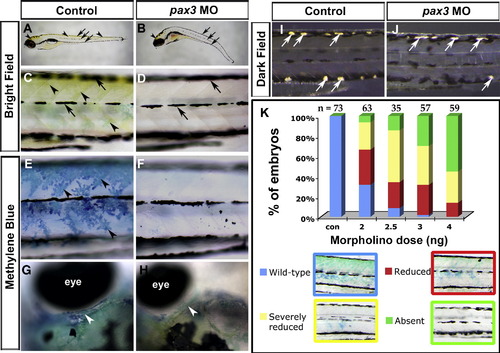
Pax3 knockdown blocks terminal differentiation of trunk xanthophores whilst other pigment cell types differentiate. Live control (A, C, E, G, I) or pax3 MO-injected (B, D, F, H, J) zebrafish larvae showing yellow xanthophore pigmentation in brightfield images (A–D), stained with methylene blue to reveal pterinosomes (E–H) or in darkfield to reveal iridophores (I, J). Lateral views (A–F, I, J) are anterior to left and dorsal to top. Dorsal views of head region (G, H) are anterior to left and lateral to top. (A–D) At 5 dpf, yellow xanthophore pigmentation is visible on the dorsal head and trunk (arrowheads). Embryonic melanophores are arranged in stripes (arrows). In pax3 morphants, no yellow xanthophore pigmentation is visible in the trunk and is reduced in the dorsal head (B, arrowhead), whereas embryonic melanophore stripes are still present and located correctly (B, D, arrows). (E–H) At 5 dpf, blue pterinosomes (arrowheads) coincide with xanthophore locations in dorsal and posterior regions overlying epaxial and hypaxial somite in the trunk (E) and above the eye in the head (G, white arrowhead). In pax3 morphants, pterinosome stain is absent from the trunk (F) and reduced in the head (H, arrowhead). (I, J) At 6 dpf, shiny iridophore pigment cells (white arrows) have begun to differentiate and are located at the dorsal and ventral larval melanophore stripes (I). Overlying xanthophores give the iridophores a yellow tint. In pax3 morphants, iridophores differentiate in both dorsal and ventral positions but appear white due to the lack of overlying xanthophores (J). (K) Severity of methylene blue-stained xanthophore phenotype in trunk is dependent on dose of pax3 MO. Overall reduction in trunk xanthophores (reduced) was distinguished from complete absence in most of the trunk (severely reduced). Number of embryos analysed (n) are given above columns. |
| Fish: | |
|---|---|
| Knockdown Reagent: | |
| Observed In: | |
| Stage Range: | Day 5 to Day 6 |
Reprinted from Developmental Biology, 317(2), Minchin, J.E., and Hughes, S.M., Sequential actions of Pax3 and Pax7 drive xanthophore development in zebrafish neural crest, 508-522, Copyright (2008) with permission from Elsevier. Full text @ Dev. Biol.