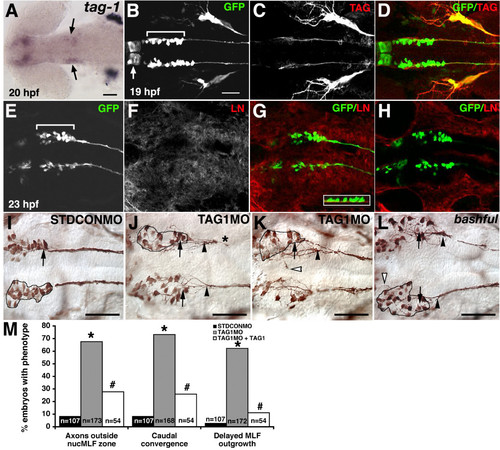
TAG-1 or laminin-α1 loss of function disrupts normal MLF axon convergence.(a-l) Ventral views, anterior to the left. (a) In situ hybridization for tag-1 in 20 hpf embryo. Arrows indicate expression in nucMLF. (b-d) Confocal projections of 19 hpf Tg(pitx2c:gfp) embryos labeled with anti-GFP (green) and anti-TAG-1 (red) antibodies. The arrow indicates unidentified cells in the diencephalon expressing the pitx2c:gfp transgene. The brackets indicate the extent of nucMLF. (e-h) Single confocal plane of nucMLF region in 23 hpf Tg(pitx2c:gfp) embryos labeled with anti-GFP (green) and anti-laminin (red). (e-g) The focal plane is at the ventral surface of the neuroepithelium. The inset in (g) is a 90 degree rotation of a z-reconstruction, with ventral down, showing the laminin underlying the nucMLF. (h) The focal plane is 4 μm dorsal to the plane in (e-g), and shows that laminin is not concentrated within the neuroepithelium. (i-l) Whole mount preparations of STDCONMO injected embryos (i), TAG1MO injectnderlying the nucMLF. (h) The focal plane is 4 μm dorsal to the plane in (e-g), and shows that laminin is not concentrated within thed embryos (j, k), and bal;Tg(pitx2c:gfp) embryos (l) labeled with an anti-GFP antibody. The outline defines the ′nucMLF zone′. Arrows indicate the normal convergence point. Filled arrowheads denote the actual convergence point. Open arrowheads label examples of MLF axons outside of the nucMLF zone. The asterisk indicates stunted MLF extension. (m) Quantification of the average percentage of embryos with MLF phenotypes. *P < 0.001, two sample binomial comparison versus STDCON. #P < 0.001, two sample binomial comparison versus STDCON. #P < 0.001, two sample binomial comparison versus TAG1MO. N equals the number of embryos. Scale bars = 50 μm. The scale bar in (b) is for (b-h).
|
