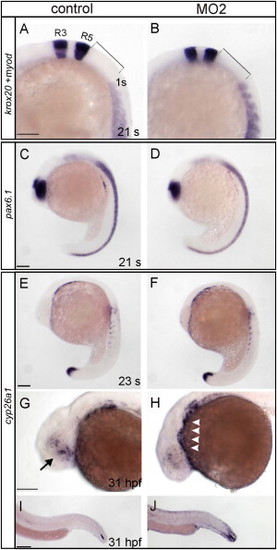
Comparison of Marker Gene Expression between Control and stra6 Morphant Embryos.
Marker genes and developmental stages of the embryos shown are indicated. Control embryo is shown at the left; stra6 morphant embryo is shown at the right. Animals were raised in PTU-free water.
(A and B) Double staining for krox20 and myoD reveals normal patterning of the hindbrain rhombomeres and somites. Additionally, the distance between rhombomere 5 (R5) and the first somite (1 s) is comparable between control and morphant embryos.
(C and D) Staining for pax6.1 (blue) at the 21-somite stage shows that the presumptive retina is smaller in stra6 morphants than in controls but that patterns of pax6.1 mRNA expression are comparable along the anteroposterior axis.
(E–J) Staining for cyp26a1 mRNA expression.
(E and F) cyp26a1 mRNA expression was indistinguishable between controls and MO2 morphants at the 23-somite stage.
(G–J) cyp26a1 mRNA expression was reduced in the developing eye of MO2-treated morphants as compared to controls (arrow in [G]), but deeper staining appeared in the pericardial region (arrowheads in [H]) and in caudal parts of the morphant embryo (J) as compared to the control (I).
Scale bars = 100 μm. Anterior is to the left in all pictures.
|
