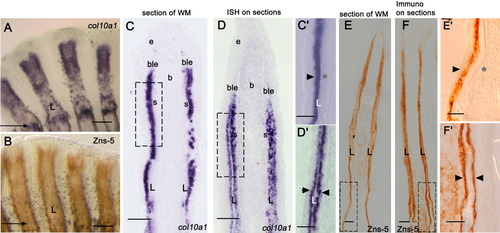
Comparison of the expression pattern of two bone markers, col10a1 (A, C, D, C′, D′) and Zns-5 (B, E, F, E′, F′), within the fin regenerate following two different in situ hybridization and immunostaining techniques. Whole-mount in situ hybridization (ISH) with col10a1 RNA antisense probe (A) and immunostaining with Zns-5 antibody (B) on 4-dpa regenerates. Arrows in A and B indicate the level of amputation. C, C′, E, E′: Longitudinal cryo-sections of the whole-mount 4-dpa fin regenerates shown in A and B. D, D′, F, F′: ISH of col10a1 probe (D, D′) and immunostaining using Zns-5 antibody (F, F′) performed on longitudinal cryo-sections of 4-dpa regenerates. C: col10a1 expression on sections following ISH is found in the basal layer of the epidermis and also in the scleroblast cells lining the outer lepidotrichia. D: In addition, when ISH is performed on cryo-sections, col10a1 expression is also detected in the scleroblasts lining the inner side of the regenerating lepidotrichia. C′, D′: Higher magnification of the area indicated by the dashed box in C and D, respectively. Black arrowheads in C′ and D′ indicate expression in scleroblasts. Note that the inner scleroblasts (right arrowhead in D′) are only detected when an ISH is performed on cryo-sections. The asterisk in C′ indicates the absence of detected expression in the inner scleroblasts when sections are done following a whole-mount ISH. E: On sections obtained after immunostaining on whole-mount samples, the Zns-5 antibody is staining all the outer scleroblasts along the entire length of the regenerate and the inner scleroblasts located in the distal part of the regenerate but not the more proximal one, which are only detected following immunostaining on cryo-sections (F). E′, F′: Higher magnification of the area indicated by the dashed box in E and F, respectively. Black arrowheads in E′ and F′ indicate expression in scleroblasts. Note that staining in the inner scleroblasts (right arrowhead in F′) is only detected when the procedure is performed directly on cryo-sections. The asterisk in E′ indicates the absence of detection in the inner scleroblasts when sections are done following immunodetection on a whole-mount sample. L, lepidotrichia; b, blastema; ble, basal layer of epidermis; s, scleroblasts. Scale bars = 100 μm (A,B), 50 μm (C,D), 25 μm (C′, D′, E, E′, F, F′).
|
