
Fig. 8
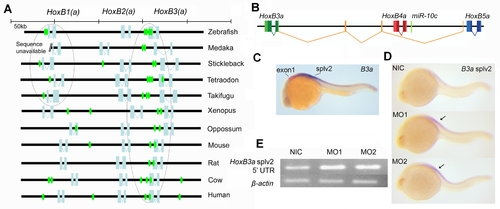
Evolutionary conservation of miR-10 targetsites and autoregulation of miR-10c A) Putative miR-10 target sites are indicated by seed sequences in the sense strand of the anterior vertebrate HoxB(a) clusters. Seed sequences are shown in green, open reading frames are indicated in light blue. Note conserved association of target sites with the HoxB3(a) ORF and conserved presence of a putative target site in Teleost HoxB1a. B) The HoxB3a splv2 polycistronic transcript includes one exon between HoxB4a and HoxB5a, two exons between HoxB4a and HoxB3a and the main HoxB3a coding sequence. The primary transcript for this isoforms includes miR-10c. The 52 UTR sequence is shown in orange, this sequence corresponds to the probe used in C and D to specifically detect this splice isoforms. C) Comparison of the HoxB3a exon1 expression (red) and the expression of HoxB3a splv2 (purple). HoxB3a splv2 is expressed posterior to the main rhombomere 5/6 expression domain of HoxB3a as reported previously [46]. The staining reaction for HoxB3a splv2 was developed for much longer than the reaction for the HoxB3a exon1 probe and the HoxB3a splv2 is presumably expressed at a much lower level. D) In situ hybridization with HoxB3a splv2. Expression is upregulated in miR-10 morphant embryos (arrows). E) Semi quantitative RT-PCR for the HoxB3a splv2 52 UTR, ß-actin is used as loading control. HoxB3a is upregulated in miR-10 morphant embryos. HoxB3a splv2: 31 cycles, ß-actin: 22 cycles. |