
Fig. 2
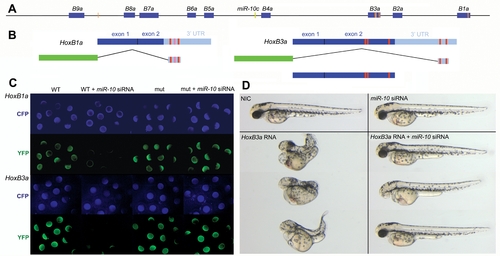
miR-10 target sites within the HoxBa cluster. A) Schematic representation of the zebrafish HoxBa cluster with MiR-10 seed sequences (nucleotide 1-7) within the sense strand indicated as orange bars. Known and EST database inferred mature Hox transcripts are indicated in blue. The miR-10c microRNA gene is indicated in green. B) Schematic representation of the HoxB1a and HoxB3a E-YFP sensor constructs and the HoxB3a overexpression construct. Red boxes indicate the position of the seed sequences. The light red box in the HoxB1a 3′ UTR is a target site flanked at position one by a T instead of an A. C) Validation of the HoxB1a and HoxB3a E-YFP sensor constructs by injection of wildtype (WT) and seed mutant (mut) constructs in presence and absence of miR-10 siRNA. E-CFP was co-injected as a loading control. D) Phenotypic sensor assay to validate the HoxB3a ORF miR-10 target sites. Overexpression of 40pg HoxB3a results in severe anterior and posterior truncations that are rescued by co-injection with miR-10 siRNA |