
Fig. 2
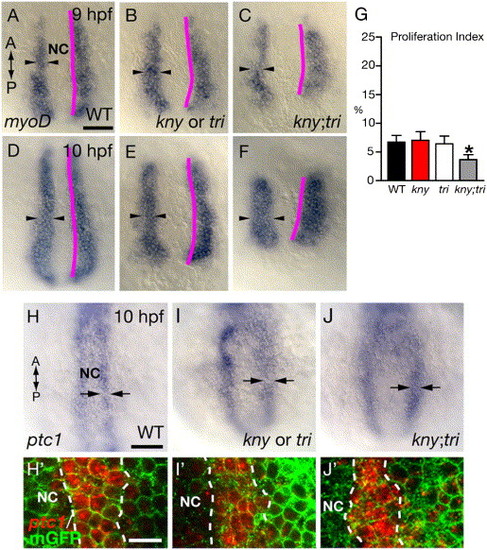
C&E movements define the number of prospective adaxial cells specified during gastrulation. (A–F) myoD RNA expression in the prospective adaxial cells. Purple lines delineate the interface between the axial and presomitic tissues. Arrowheads show the ML width of the myoD-expression domain. (G) Proliferation indices of the prospective adaxial cells (number of proliferating myoD-expressing cells/total number of myoD-expressing cells) at the tailbud stage (10 hpf). 10 embryos of each genotype were analyzed. Error bars represent the standard error. Asterisk: p < 0.05, kny;tri mutant versus WT. (H–J) ptc1 RNA expression at the tailbud stage. (H′–J′) ptc1 RNA expression (red) detected by fast red staining. (A–F, H–J, H′–J′) Dorsal views. NC, notochord. Scale bars: (A–F, H–J) 100 μm; (H2–J2) 20 μm. |
| Genes: | |
|---|---|
| Fish: | |
| Anatomical Terms: | |
| Stage Range: | 90%-epiboly to Bud |
Reprinted from Developmental Biology, 304(1), Yin, C., and Solnica-Krezel, L., Convergence and extension movements mediate the specification and fate maintenance of zebrafish slow muscle precursors, 141-155, Copyright (2007) with permission from Elsevier. Full text @ Dev. Biol.