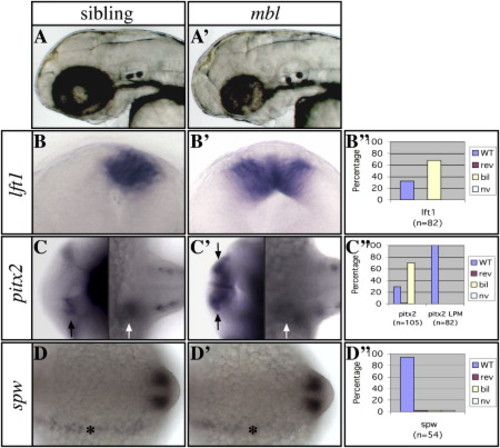
The mbl Mutation in axin1 Causes Brain-Specific Loss of Asymmetric Nodal Pathway Gene Expression (A and A′) Lateral views of the head with anterior to the left of 2-day-old living wild-type (left) and mbl mutant (right) embryos. (B and B′) Frontal views of the epithalamus (dorsal to the top) of 24s stage wild-type and mbl embryos. (C and C′) Dorsal views of the brain (left) and trunk LPM (right) of 24s stage wild-type and mbl embryos with anterior to the left. (D and D′) Dorsal views of the trunk LPM of 14s stage wild-type and mbl embryos with anterior to the left. The markers used to assess asymmetries are indicated to the left of the panels. (B″–D″) Graphs illustrate the percentage of mbl embryos with wild-type (WT) left, reversed (rev) right, bilateral (bil), or not visible (nv) Nodal pathway gene expression (see also Table S1). Note the loss of asymmetry in Nodal pathway gene expression in the epithalamus ([B], [B′], and black arrows in [C] and [C′]), but not the lateral plate mesoderm (LPM; white arrows in [C] and [C′] and asterisks in [D] and [D′]) in mutants. The expression analysis of lft1 and pitx2 in all figures refers to expression in the brain, unless indicated otherwise.
|
