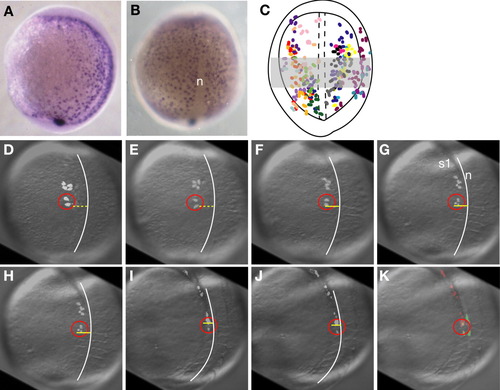
Location of cells at tail bud that potentially give rise to the pancreas. A: Lateral view of sox17 expression at tail bud. B: Dorsal view of sox17 expression at tail bud. n: notochord. C: Locations of all cells (excluding cells in the extreme anterior and posterior) from 20 different embryos that had one or more labeled cells in one or both of the pancreatic buds. Each color represents a different embryo. Embryos were mounted in dorsal view with the equator of the embryo (approximately the level of the first somite) closest to the viewer. The gray square marks an area that includes labeled cells from all embryos and marks the likely location of the pancreatic progenitors at the end of gastrulation (tail bud stage, 10 hours postfertilization [hpf]). The outline of the notochord is indicated by dashed lines. D-J: Representative confocal projections from time-lapse experiment between 95% epiboly and 14 somites (approximately 9.5 hpf-16 hpf). Images are approximately equally spaced in time. Red circle contains cells that later colocalize with pdx1-green fluorescent protein (GFP) positive cells. K: Location of rhodamine dextran-labeled cells (red) at 16 hpf with cells that are positive for GFP (green). The dashed yellow line is the future division between somites 1 and 2. The solid yellow line marks the boundary between somites 1 and 2. The solid white line marks the notochord.
|
