
Fig. 3
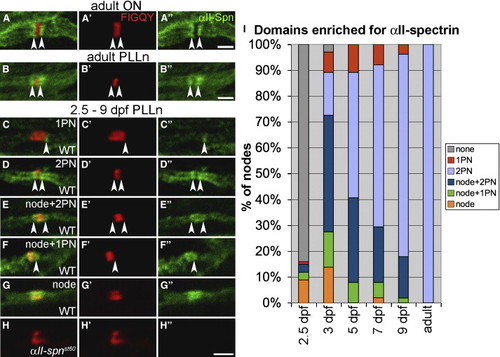
Localization of αII-Spectrin in Myelinated Axons (A–B) Adult optic nerve (A) and PLLn (B) labeled with anti-αII-spectrin. Nodes are labeled with anti-FIGQY [6]. The anti-αII-spectrin labeling alone is shown in (A22) and (B22). Expression of αII-spectrin is enriched in the paranodes (indicated by arrowheads). (C–G) Nodes from the PLLn of 2.5–9 dpf embryos and larvae labeled with anti-FIGQY and anti-αII-spectrin. The anti-αII-spectrin labeling alone is shown in (C22)–(G22). At these stages, αII-spectrin is enriched in various combinations of nodes and paranodes. Arrowheads indicate αII-spectrin enrichment in paranodes (PN). (H) No αII-spectrin labeling was detected in αII-spnst60 mutants. (I) A histogram indicating percentages of PLLn nodes with different αII-spectrin localization patterns at 2.5 dpf (101 nodes from 6 embryos), 3 dpf (102 nodes from 16 embryos), 5 dpf (101 nodes from 13 larvae), 7 dpf (104 nodes from 17 larvae), 9 dpf (106 nodes from 18 larvae), and adult stage (94 nodes from 3 adults). A node or paranode was considered enriched if its anti-αII-spectrin labeling was appreciably greater than the neighboring internodes. All scale bars represent 2 μm. |