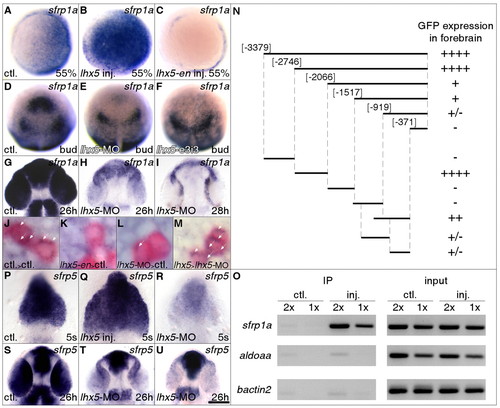
Lhx5 regulates Sfrp1a and Sfrp5 expression. (A-I) Lhx5 regulates Sfrp1a expression. (A-C) Animal pole views, dorsal to the right. (D-F) Dorsal views, bud stage, sfrp1a expression. (G-I) Flat mounts in glycerol; dorsal views, rostral to the top. 2 ng (H) or 4 ng (I) of lhx5 morpholino was injected. (J-M) Lhx5 cell autonomously regulates Sfrp1a expression. Transplanted cells are labeled in red. sfrp1a transcripts are highlighted by white arrowheads and are apparent as blue dots in the narrow cytoplasm around the nuclei of transplanted cells in controls (J, ctl) and lhx5 mRNA-injected cells transplanted into lhx5 morpholino injected hosts (M). sfrp1a transcripts are not detected in lhx5-en injected cells transplanted into control hosts (K). In transplanted lhx5 morpholino-injected cells, sfrp1a expression is reduced (L). (J-L) 90% epiboly stage; (M) one-somite stage. (N) Mapping of sfrp1a upstream enhancers by transient GFP reporter expression in the forebrain. Fragments are numbered using the first nucleotide of the Sfrp1a start codon as the reference. GFP expression in the forebrain was scored at the 3 somite stage and the Prim-5 stage. The number of + signs indicate relative GFP expression levels. (O) Lhx5 binds to the sfrp1a promoter. Input represents 0.2% (2 μl, 2x) or 0.1% (1 μl, 1x) of starting material for each immunoprecipitation reaction. 2 μl (2x) or 1 μl (1x) of purified DNA product from each sample was used in the PCR. ctl., uninjected embryos treated in parallel; inj., lhx5-GFP mRNA-injected embryos. Mock immunoprecipitation with no antibody fails to amplify from either uninjected or injected groups (data not shown). (P-U) Lhx5 regulates Sfrp5 expression. Flat mounts in glycerol, dorsal views, rostral to the top. (R,T,U) 2 ng (R,T) or 4 ng (U) of lhx5 morpholinos was injected. Scale bar in U: 250 μm for A-F; 100 μm for G-I; 8 μm for J-M; 100 μm for P-U.
|

